Posts

Fixing Indicator Images

Indicators, a new feature of Reporting Services 2008 R2, let you show images for state values on your reports and avoid using custom images and expressions. Sean Boon’s recent blog shows you how to scale the indicator images. One annoying issue business users reported when working with indicators is that the indicator image stretches if the text grows and spills to the next row. For example, on the report below the second row spans two lines and its indicator images are stretched vertically.

052110_2222_FixingIndic1

Unfortunately, the indicator region doesn’t have a property to “fix” the image size. The only workaround for now is to enclose the entire indicator region in a rectangle: a kludgy hack especially for business users.

Microsoft SQL Server 2008 R2 Feature Pack Available

Microsoft released the Microsoft SQL Server 2008 R2 Feature Pack. Among other things, it includes Report Builder 3.0, Reporting Services SharePoint Add-in, and PowerPivot for Excel.

Atlanta.MDF Presentation

My presentation “What’s New in Reporting Services 2008 R2” for the local Atlanta.MDF group went well last night. We had some 80 people attending and I had some great questions. Too bad I couldn’t beat my previous attendance record. I guess rain and traffic were deterrent factors. Thanks for everyone who attended! I posted the presentation materials on my website. It should be available shortly on the Atlanta.MDF site as well.

Synchronizing Reporting Services Groups

One new R2 feature that I discovered while reading the Reporting Services Recipes book, is group data synchronization. Consider the following report (download the two sample reports here):

050310_2342_Synchronizi1

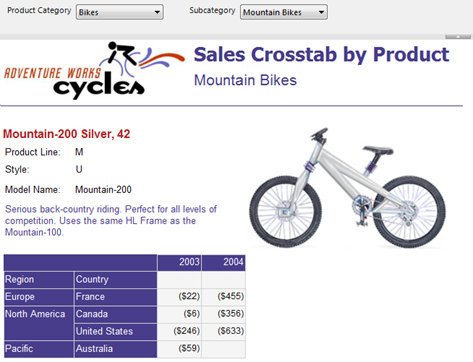
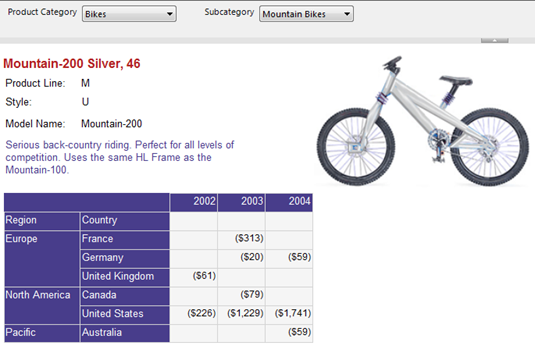
In this report, the matrix region is nested inside a list region. The list region pages (groups) on product while the nested matrx region displays the sales for the current product grouped by region and year. As you can see, Mountain-200 Sliver, 42 has data for years 2003 and 2004 but if you move to the next page, you will see that Montain-200 Silver, 46 has sales for 2002, 2003, and 2004.

050310_2342_Synchronizi2

What if you want to synchronize the instances of the matrix region to return the same number of columns, which in this case would it all available years in the dataset? In R2, this takes a few clicks.

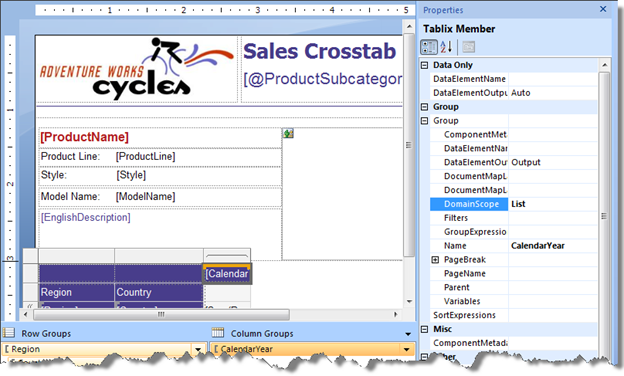
  1. In design mode, click anywhere inside the nested matrix region so the Groups pane shows its groups.
  2. Select the CalendarYear column group on which the matrix region pivots.
  3. Expand the Group section in the Properties window and enter the name of the outer region in the DomainScope property. In this case, the outer region is the list region whose name is List.

050310_2342_Synchronizi3

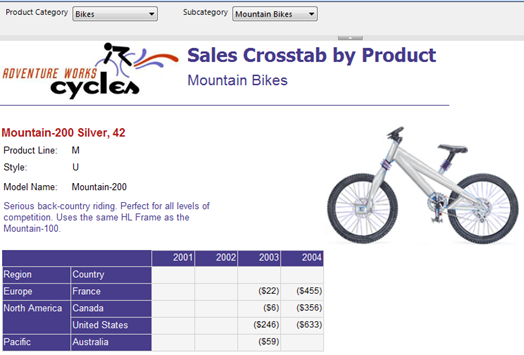
Now, when you run the report, all instances of the matrix region are synchronized and have the same number of columns irrespective of the fact that they might not have data for given years.

050310_2342_Synchronizi4

DomainScope is similar to expression scope but not the same. DomainScope can be set on a group leaf member only. So, if the matrix region was grouping on years and quarters, you can synchronize quarters only in which case each year would show four quarters. You cannot synchronize the Year level because it’s a parent group. In addition, the domain scope can be an outer group or region. Unlike expression scopes, you cannot synchronize on a dataset.

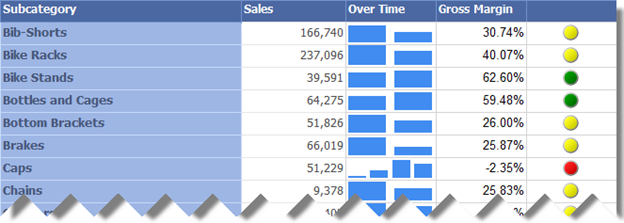
Group synchronization comes also handy when you work with sparklines. For example, the following report includes an Over Time column that shows a bar sparkline for product category sales over years.

050310_2342_Synchronizi5

As you can see, the Caps category has sales for four years (The AventureWorksDW2008 database has data for years 2001-2004), while Bib-Shorts category has data for two years. However, the sparklines groups are not aligned. For instance, you can’t tell which two years Bib-Shorts have sales for. To fix this:

  1. Double-click the sparkline region to show the Chart Data window.
  2. Click the CalendarYear group and set the DomainScope property to the name of the containing tablix region, Tablix1 in this case.

050310_2342_Synchronizi5

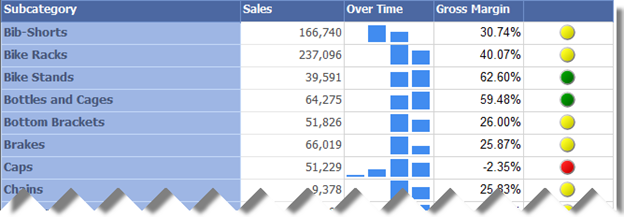
Now, when you run the report, you’ll see that the sparkline group ordinal position reflects the year. Thus, knowing the range of available years (2001-2004) which for clarity you can display on the report, e.g. as a subtitle, Bib-Shorts have data for years 2002 and 2003, while Bike Racks have data for 2003 and 2004.

050310_2342_Synchronizi7

Reporting From OData Services

Open Data Protocol (OData), previously known as ADO.NET Data Services, is quickly gaining popularity as a web protocol for querying and updating data. A few Microsoft products already expose their functionality as OData services, including SharePoint 2010, SQL Azure, and Reporting Services (see my blog about reports as data feeds). Therefore, chances are that you may need to report off OData services. As it stands, Reporting Services doesn’t include a native support for OData but the XML Data Provider, which has been around since version 2005, may get the job done.

The OData report demonstrates how you can use the XML Data Provider to query OData services. It has two datasets. The Customers dataset retrieves data from the sample Northwind OData service. The CompanySales dataset queries the Adventure Works Company Sales report as a data feed.

Northwind OData Service

The Northwind datasets shows a list of Northwind customers. I implemented the report as follows.

  1. Set up the Northwind data source that uses the XML Data Provider and whose connection string points to the Northwind Customers service.
    http://services.odata.org/Northwind/Northwind.svc/CustomersAs you’ve probably guessed it, you need to set up a data source for each OData service you want to query. If you open the above link in IE with the feed view turned off (Internet Options, Content tab, Settings, uncheck Turn On Feed Reading View), you will see the output of the service.

    <?xml version=”1.0″ encoding=”utf-8″ standalone=”yes” ?>

<feed xml:base=”http://services.odata.org/Northwind/Northwind.svc/
xmlns:d=”http://schemas.microsoft.com/ado/2007/08/dataservices
xmlns:m=”http://schemas.microsoft.com/ado/2007/08/dataservices/metadata xmlns=”http://www.w3.org/2005/Atom“>

  <title type=”text“>Customers</title>

  <id>http://services.odata.org/Northwind/Northwind.svc/Customers</id>

  <updated>2010-04-25T15:07:07Z</updated>

  <link rel=”self title=”Customers href=”Customers” />

<entry>

  <id>http://services.odata.org/Northwind/Northwind.svc/Customers(‘ALFKI’)</id>

  <title type=”text” />

  <updated>2010-04-25T15:07:07Z</updated>

<author>

  <name />

  </author>

  <link rel=”edit title=”Customer href=”Customers(‘ALFKI’)” />

  <link rel=”http://schemas.microsoft.com/ado/2007/08/dataservices/related/Orders type=”application/atom+xml;type=feed title=”Orders href=”Customers(‘ALFKI’)/Orders” />

  <link rel=”http://schemas.microsoft.com/ado/2007/08/dataservices/related/CustomerDemographics type=”application/atom+xml;type=feed title=”CustomerDemographics href=”Customers(‘ALFKI’)/CustomerDemographics” />

  <category term=”NorthwindModel.Customer scheme=”http://schemas.microsoft.com/ado/2007/08/dataservices/scheme” />

<content type=”application/xml“>

<m:properties>

  <d:CustomerID>ALFKI</d:CustomerID>

  <d:CompanyName>Alfreds Futterkiste</d:CompanyName>

  <d:ContactName>Maria Anders</d:ContactName>

  <d:ContactTitle>Sales Representative</d:ContactTitle>

  <d:Address>Obere Str. 57</d:Address>

  <d:City>Berlin</d:City>

  <d:Region m:null=”true” />

  <d:PostalCode>12209</d:PostalCode>

  <d:Country>Germany</d:Country>

  <d:Phone>030-0074321</d:Phone>

  <d:Fax>030-0076545</d:Fax>

  </m:properties>

  </content>

  1. Set up a dataset query.

    <Query>

        <ElementPath IgnoreNamespaces=”true”>

            feed{}/entry{}/content{}/properties

        </ElementPath>

    </Query>


    The IgnoreNamespaces attribute instructs the provider to ignore the XML namespaces. The ElementPath text specifies a path to the element whose nodes you want to display. In this case, the element is properties which is the element that contains the interesting OData stuff. The empty curly braces for the preceding nodes are used to ignore information from the preceding nodes in the path.

CompanySales

Since starting with R2, reports are available as data feeds, you may also implement a quick and easy way to display data from one report in another. In this blog, I provided more details about the query syntax. In the case of the Company Sales, the data source connection string is as follows:

http://localhost/ReportServerR2?/Adventure Works Sample Reports/Company Sales 2008&ShowDescription=False&StartDate=01/01/2002 00:00:00&EndDate=12/31/2003 00:00:00&rs:ParameterLanguage=&rs:Command=Render&rs:Format=ATOM&rc:DataFeed=xAx0x2xCx0xMx0

The dataset query is the same because all OData services return data in the same format.

Moving forward, it will be nice if a future release includes a native OData provider that handles parameters and supports methods, as the XML Data Provider does for SOAP web methods, so you don’t have to set up a data source for each OData service.

SQL Server 2008 R2 Released to Manufacturing

Robert Bruckner announced that SQL Server 2008 R2 was released to manufacturing today. Robert summarized the most important most features. I covered them in my blog as well. I’ll update this blog once I find out when R2 will be available on MSDN.

UPDATE

According to this Microsoft blog, R2 will be available for MSDN subscribers on May 3rd.

Feeding Reports by Code

In a previous blog, I introduced one of the new SSRS 2008 R2 feature: reports as data feeds. As I said, the R2 release will include a new Atom Data Feed renderer to produce an Atom service document (*.atomsvc) which defines a feed(s) per data region. I also said that the main scenario for report feeds was to let the PowerPivot add-in for Excel (previously known as Gemini) consume report data. Recently, I’ve watched the interesting Pablo Castro’s “ADO.NET Data Services: What’s new with the RESTful data services framework” presentation which got me inspired to find a way to consume a report data feed programmatically outside PowerPivot. Since the Atom feed format is pre-defined, a custom application could benefit from this scenario to retrieve and manipulate the report data. In this case, an atom feed may be preferable than other format, such as CSV, because data is exposed as properties instead of columns.

So, I embark on a journey to write a small Silverlight app, RSFeedReader, that reads and displays a report feed. You will need Visual Studio 2010 to open the RSFeedReader source code. Before running the application, you may need to deploy the clientaccesspolicy.xml file included in the source to the IIS root, such as c:\inetpub\wwwroot or C:\inetpub\wwwroot\wss\VirtualDirectories\80 if you have SharePoint installed on port 80, to grant the application rights to connect to Reporting Services. If you don’t, Silverlight would treat the application URL, which runs under the local ASP.NET IIS server, and Report Server URL as two different domains and it will throw a security exception.

You can enter a report feed in the textbox and hit Fetch. The data feed results are shown in the grid. Similar to PowerPivot, each row represents a row in the report data region but the properties are stacked vertically instead of horizontally. The first column shows the entry identifier which identifies the row in the data region and the second column shows the values in that row. The Generating Data Feeds from Reports BOL topic covers the technical details of report feeds pretty well. Basically, the feed URL must include a unique identifier which you obtain from the Atom service document when you export the report to the Atom Data Feed format. The default feed URL points the matrix region in the Company Sales report although you can’t tell this from the feed URL. Again, you need to get the DataFeed identifier for the region from service document after exporting to Atom. If you request the report data feed in the browser, you will see the resulting XML. The most interesting information is included in the m:properties element.

Unlike SharePoint, Reporting Services doesn’t provide a WCF endpoint, such as ListData.svc, so you can’t generate a Visual Studio proxy (unless you do it manually). Instead, RsFeedReader, uses WebClient to submit the URL request to Reporting Services to obtain the feed.

protected void LoadFeed(string uri)

{

WebClient wc = new WebClient();

wc.OpenReadCompleted += new OpenReadCompletedEventHandler(wc_OpenReadCompleted);

Uri feedUri = new Uri(uri, UriKind.Absolute);

wc.OpenReadAsync(feedUri);

}

private void wc_OpenReadCompleted(object sender, OpenReadCompletedEventArgs e)

{

if (e.Error != null)

{

txtFeedLoc.Text = “Error load report data feed. “ + e.Error.Message;

return;

}

using (Stream s = e.Result)

{

SyndicationFeed feed;


using (XmlReader reader = XmlReader.Create(s))

{

// read the feed

feed = SyndicationFeed.Load(reader);

var posts = from item in feed.Items

select new FeedEntry(item.Id, (XmlSyndicationContent)item.Content);


// show feeds in grid

dGrid.ItemsSource = posts;

dGrid.Visibility = Visibility.Visible;

}

}

}


Once the asynchronous call completes, RsFeedReader loops through the feed entry elements and populates a collection of FeedEntry objects which I bind to the grid. The FeedEntry class parses the content element of the entry (where the properties are located) and exposes them as a ContentProperties object (not shown) which I bind to the nested grid in the LoadingRow event of the outer grid.

It probably won’t be long before various custom applications start popping up that lets end users subscribe to feeds, such as to let the end user get notified when report content changes.

Product Release Galore

Microsoft announced release dates for SQL Server R2, SharePoint 2010, Office 2010, and Visual Studio 2010.

  • According to the Microsoft SQL Server Team Blog: SQL Server 2008 R2 (aka SQL 2010) will be listed on Microsoft’s May price list, and will be available by May 2010
  • According the Microsoft SharePoint Team Blog: SharePoint 2010 and Office 2010 will be officially launched on May 12, 2010 with an RTM date of April 2010
  • Visual Studio 2010’s release date was pushed to April 12, 2010 due to some performance issues according to Developer Division’s Marketing and Communications Manager Rob Caron’s blog.

2010 is sure a busy year for BI!

BIDS Integration Story in R2 – The Good, the Bad, and the Ugly

There was a huge discussion thread about the BIDS-Visual Studio integration story in the SQL Server 2008 timeframe where customers complained that BIDS got married with Visual Studio. This required switching both BI and code projects at the same if you want to have a solution with both project types. What has changed in R2?

The good – Report Server projects in BIDS R2 can target either SQL Server 2008 or R2, as explained in this blog. There is no change to Analysis Services projects. If you have a Report Server project with RDL 2008 files, the BIDS Report Designer won’t upgrade the report definitions. However, the moment you add a R2-specific feature, such as the new map region, BIDS will upgrade the report definition to R2 RDL. Therefore, if you want to play with R2 on your machine while the rest of the team is still on 2008 and you are careful, you can install R2 and upgrade BIDS without affecting the rest.

The bad – The R2 Report Server project format has changed to accommodate the new project deployment settings which are explained in the above-mentioned blog. The first time you open a Report Server project in BIDS R2, you will be asked to upgrade the project (not the RDLs). But what if you are forging new frontiers in your company (aka not following corporate standards) and decide to move to R2 while your peers are still on SQL 2008 assuming you use source control and share project files? No worries. BIDS 2008 will automatically strip out the elements in the report project file it doesn’t recognize. But when they save the project the project file will revert to the 2008 format, so you’ll get prompted again to upgrade the next time you load the project in BIDS. To solve this problem, I use a local project file.

The ugly – R2 doesn’t integrate with Visual Studio 2010 as it targets VS 2008 only. And since BI project types are part of BIDS and not Visual Studio, VS 2010 users won’t get the BI project templates either. In other words, you must have BIDS R2 and Visual Studio 2010 SxS. Consequently, you won’t be able to have a solution that spans both Visual Studio 2010 code projects and BI projects. This is like having one TV to watch US channels and a second TV to watch Euro.

It will be nice if one day the SQL Server setup program detects the Visual Studio version installed and ask you which version you want to integrate with. But given that Visual Studio project formats change between releases this may remain a wishful thinking.

Where is RDLOM in R2?

After covering the cool new stuff in R2, it’s time to talk about the uncool. One R2 change that really vexes me is RDLOM. RDLOM, short for Report Definition Language Object Model, lets developers program RDL in object-oriented way as opposed to using XML. RDLOM could save you a lot of effort when you have to meet more advanced requirements that involve pre-processing RDL. For example, in one of my projects we had to implement a wizard that would walk business users through steps to generate an ad-hoc report. Behind the scenes, the wizard would generate the report definition by using a custom RDLOM which we developed since back then Microsoft didn’t have their own. I included a scaled-down version of our implementation in my TechEd 2007 code sample. Although it took us a while to get our RDLOM implemented, it turned out to be invaluable down the road. Since we didn’t have to use XML API to manipulate RDL, it simplified programming RDL. For another project, we used RDLOM to let the customer specify which sections they want to see on the report. Once the selection was made, we would remove the unwanted sections from a report template. The list of real-life scenarios that could take advantage of RDLOM goes on …

Apparently, I wasn’t the only one bugging Microsoft about RDLOM that ships with SSRS and they promised that this will happen at TechED 2007 USA. Sure enough, SSRS 2008 brought us an unsupported version which I blogged about and covered more extensively in my Applied SSRS 2008 book. Although unsupported, the SSRS 2008 RDLOM was very useful. It was implemented in a single assembly (Microsoft.ReportingServices.RdlObjectModel.dll), exposed all RDL elements as objects, and supported serializing and deserializing RDL.

Alas, this will come to pass with R2. Upgrading to R2, you’ll find that the classes in Microsoft.ReportingServices.RdlObjectModel are marked as internal so you cannot use this assembly. Instead, RDLOM got moved into the Microsoft.ReportingServices.Designer.Controls.dll assembly. The good news is that there are rumors that RDLOM may get documented. Now the bad news:

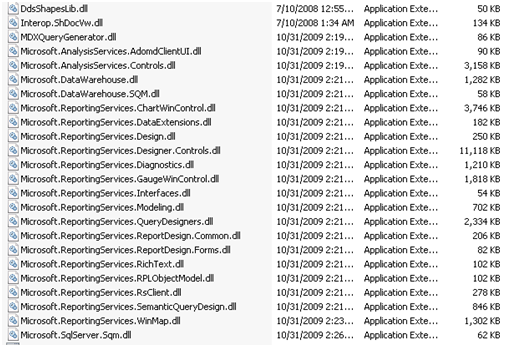
  1. Clearly, R2 RDLOM was not meant to be distributed. While you need to reference explicitly only Microsoft.ReportingServices.Designer.Controls and Microsoft.ReportingServices.RichText assemblies you’ll find that they are dependent on other assemblies and you need to distribute a total of 25 assemblies resulting in a whopping 25 MB of referenced code. One way to avoid shipping so many assemblies to deploy your application in the BIDS or Report Builder 3.0 folders.

030910_0215_WhereisRDLO1

  1. R2 RDLOM will be 32-bit only because BIDS and Report Builder are 32-bit only.
  2. R2 RDLOM doesn’t support serializing the object model. I found a hack that uses .NET reflection to invoke the internal Serialize method of the old RDLOM 2008.

The RDLOM R2 C# console application bundled in this code sample demonstrates how you can use the “new” RDLOM. Besides referencing the new assemblies, you need to use the Load method to deserialize RDL to the object model:

report = Report.Load(fs);

And the above-mentioned hack to serialize it back to disk or stream.

using (FileStream os = new FileStream(ReportPath, FileMode.Create)) {

Assembly assembly = Assembly.GetAssembly(typeof(Report));

object mc = assembly.CreateInstance(“Microsoft.ReportingServices.RdlObjectModel.Serialization.RdlSerializer”);

Type t = mc.GetType();

MethodInfo mi = t.GetMethod(“Serialize”, new Type[] { typeof(Stream), typeof(Report) });

report = (Report)mi.Invoke(mc, new object[] { os, report });

}

Other than that, RDLOM remains virtually unchanged from 2008 excluding that it now supports the R2 enhancements to RDL. What if you don’t need this overhead but you need to make small changes to RDL that don’t necessarily require an object-oriented layer. I’ve found that the easiest way to do this and avoid XML programming is to use LINQ to XML. The LINQ to XML project included in the same sample demonstrates this approach. For example, the following code changes the data source reference of the first data source.

static void Main(string[] args) {

XElement report = XElement.Load(“report.rdl”);

string dns = “{“ + report.GetDefaultNamespace() + “}”;

XElement ds = report.Element(dns + “DataSources”).Element(dns + “DataSource”).Element(dns + “DataSourceReference”);

ds.Value = “/Data Sources/AdventureWorksAS2008”;

report.Save(“report1.rdl”); }

Not happy about the RDLOM story? Join the movement and vote for my suggestion on connect.microsoft.com to have a supported RDLOM.