The other day I decided to spend some time and educate myself better on the subject of aggregations. Much to my surprise, no matter how hard I tried hitting different aggregations in the Internet Sales measure group of the Adventure Works cube, when I got the Get Data From Aggregation event in the SQL Profiler, it always indicated an Aggregation 1 hit. Aggregation 1 100,111111111111111111111…
As Analysis Services users undoubtedly know, partitioning and aggregations are the two core tenants of a good Analysis Services data design. Or, at least they have been since its first release. The thing though is that a lot of things have changed since then. Disks and memory got faster and cheaper, and Analysis Services have been getting faster and more intelligent with each new release.…
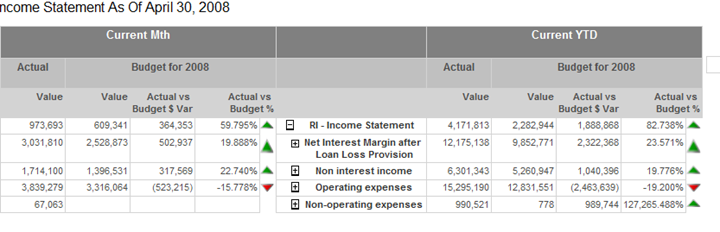
Indicators, a new feature of Reporting Services 2008 R2, let you show images for state values on your reports and avoid using custom images and expressions. Sean Boon's recent blog shows you how to scale the indicator images. One annoying issue business users reported when working with indicators is that the indicator image stretches if the text grows and spills to the next row. For…
Visual Studio 2010 ships with updated ReportViewer controls which Brian Hartman discusses in his blog. One issue I recently run into with the Visual Studio 2008 ReportViewer ASP.NET control with a chart configured for a dynamic height (DynamicHeight property) where the chart image wouldn't size properly. I found that the issue got fixed in the Visual Studio 2010 ReportViewer. However, in my case we weren't…
Microsoft released the Microsoft SQL Server 2008 R2 Feature Pack. Among other things, it includes Report Builder 3.0, Reporting Services SharePoint Add-in, and PowerPivot for Excel.
My presentation "What's New in Reporting Services 2008 R2" for the local Atlanta.MDF group went well last night. We had some 80 people attending and I had some great questions. Too bad I couldn't beat my previous attendance record. I guess rain and traffic were deterrent factors. Thanks for everyone who attended! I posted the presentation materials on my website. It should be available shortly…
There is still time to register for the online Applied Analysis Services 2008 class run on May 17th. No travel, no hotel expenses, just 100% content delivered right to your desktop! This intensive 3-day online class (14 training hours) teaches you the knowledge and skills to master Analysis Services to its fullest. Use the opportunity to ask questions and learn best practices. For more information…
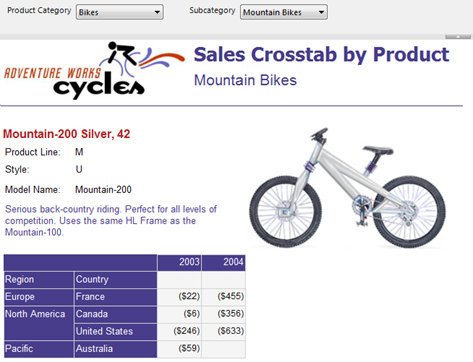
One new R2 feature that I discovered while reading the Reporting Services Recipes book, is group data synchronization. Consider the following report (download the two sample reports here): In this report, the matrix region is nested inside a list region. The list region pages (groups) on product while the nested matrx region displays the sales for the current product grouped by region and year. As…
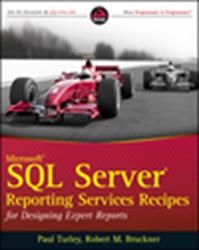
This is a review of the latest addition to the long repertoire of Reporting Services books – Microsoft SQL Server Reporting Services Recipes (ISBN: 978-0-470-56311-3). When you learn a new technology you suggest you pick up several books covering this product because every author writes from his own experience. Thus, even books covering the same technology are not competing by completing each other. Some books…