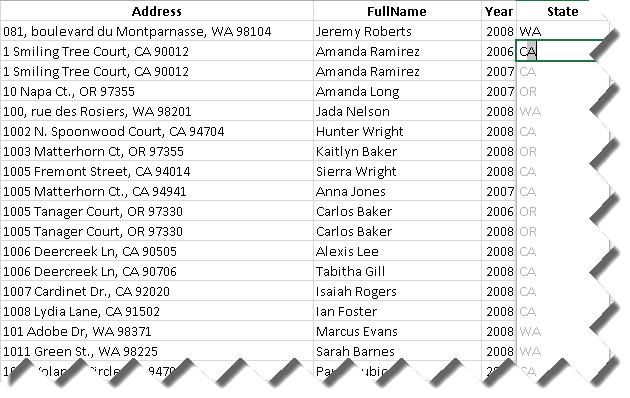
Excel 2013 includes features that improve productivity. Here are the ones related to BI. Flash Fill Suppose that you have a list of customers with addresses. When analyzing the data, you might want to analyze sales by USA states but the data doesn't include a state column. Instead, suppose you have an address column that includes the mailing address, state, and zip code. So, you…
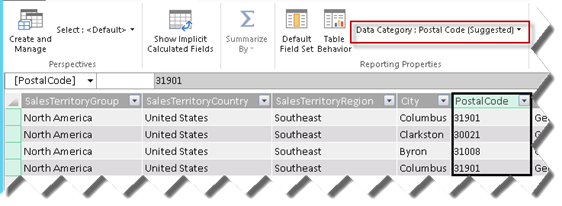
[View:https://prologika.com/CS/cfs-file.ashx/__key/CommunityServer.Blogs.Components.WeblogFiles/blog/7762.Geography.xlsx:550:0] Power View in Office 2013 brings the following new features: Integration with Excel 2013 – Microsoft has decoupled Power View from SharePoint and included it in Excel so you can create ad-hoc reports connected to BI models, just like you can create pivot reports. I hope the PerformancePoint Decomposition Tree will follow suit. New visualizations – This includes interactive and drillable geospatial maps and…
Jen Underwood wrote a great summary about what's new in Office 13 BI. Interestingly, you'll be able to drill down to lower location in the Power View maps, e.g. from country to state and then to lowest level you placed in the location zone when configuring the map visualization.
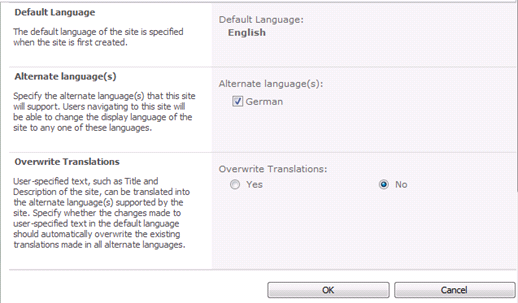
In a current project, international users indicated that they prefer dates and numbers to be formatted using their regional settings. Localization is a big and complicated topic and we've been fortunate that the scope was limited to just number and date formatting … or, at least so far. Localizing reports on a report server running in native mode is easy. You just need to use…
As you probably know by now, Microsoft unveiled the Office 2013 Technology Preview. As the portal page says, "we've Taken Self-Service BI to the Next Level". Indeed, this is where I believe we'll see Office 2013 emerging as a leading tool on the market for self-service BI. Based on my experience, business users love Excel 2010 with PowerPivot because of its familiar environment and ease…
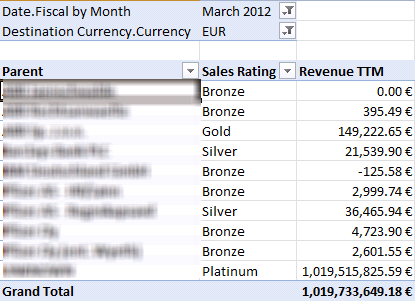
Consider the following calculated member definition added to the script in an Analysis Services cube: CREATE MEMBER CURRENTCUBE.[Measures].[Revenue TTM] AS ([Measures].[Revenue Amount USD], [Relative Date].[TTM]), FORMAT_STRING = "Currency", VISIBLE = 1; When you browse the member in Excel, you'll find that the member is not formatted as currency. However, when you use SSMS and query the member, when you double-click the member cell in the…
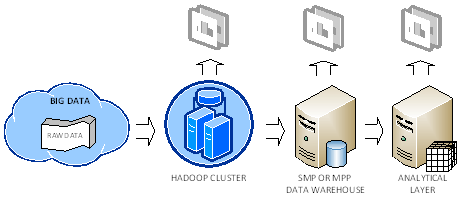
Let's recap my thoughts on Hadoop. I've found the case studies presented in the chapter 16 of the "Hadoop: The Definitive Guide" book very useful to understand how organizations are currently using Hadoop. In general, the following deployment scenario emerges as a common pattern: An organization accumulates Big Data from various sources, such as web logs, sensors, website traffic, and so on. The organization decides…