In my opinion, every mid-size to large organization should have a solution for master data management. Based on my observations, data quality issues have reached a pandemic level. Ironically, putting a "lipstick on the pig" with some cool visualizations appears to have a higher priority on the BI roadmap but it's just masking the underlying issues. The focus should be on centralizing data management and improving…
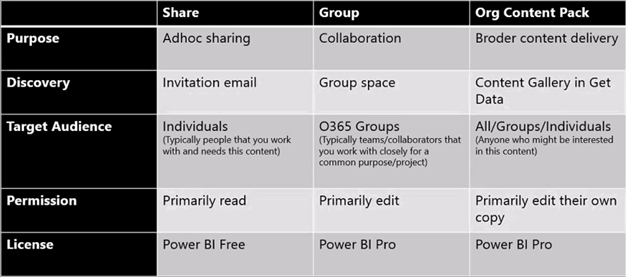
I taught Power BI to a large organization this week. Naturally, they were interested in sharing content across multiple departments and even entire organization. Let's revisit the sharing options available in Power BI which I summarize in the following table. Simple sharing – This is the only option available in Power BI Free. It allows sharing real-only dashboards and underlying reports to a small audience,…
MS BI fans, join me for the next Atlanta MS BI Group meeting on May 23th and 6:30 PM. I'll present the self-service data shaping and transformation capabilities in Power BI. Then Alteryx, who is also sponsoring the event, will show us how to bring Power BI data transformation and analytics even further with their products. I'll also showcase two interesting Power BI new features:…
SQL Saturday Atlanta will take place on May 21st. Your humble correspondent will present "What's New for BI in SQL Server 2016" scheduled to start at 8:15 AM. Join me for an hour of coverage of my favorite SQL Server 2016 new BI features. Get your questions answered. SQL Server 2016 delivers many data analytics and information management new features and enhancements. Join this session…
In a previous blog, I reviewed the claims that Tableau made in their "10 Ways Power BI Falls Short" presentation. To be fair to Power BI, in this blog I'll list 10 areas where I believe Tableau falls short compared to Power BI. Overall In this section, I'll review some general implementation and cost considerations that in my opinion make Power BI more compelling choice than…
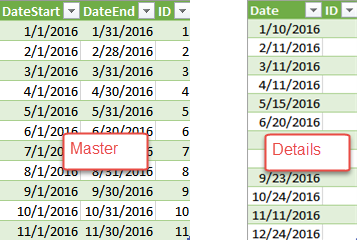
Scenario: Suppose you have two source tables coming from different data sources, such as Excel or text files, as shown in in the screenshot below. The Master table has a DateStart and DateEnd columns that denotes a date range for ID. The Details table has some date (and possibly time) values. You need to look up the ID column from the Master table where the…
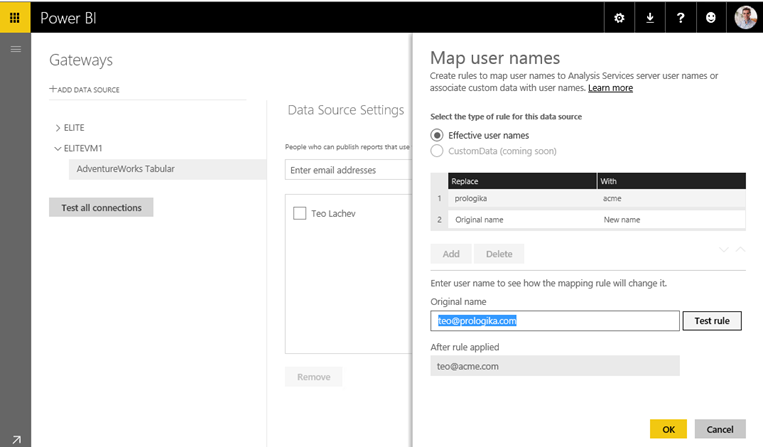
We have a great new enhancement to the Power BI Gateway – Enterprise that just came out! Many organizations are planning hybrid Power BI solutions where report and dashboard definitions are deployed to Power BI but remain in SSAS Multidimensional or Tabular semantic models on premises. At the same time, many organizations have run into the dreaded Windows security issues when the user principle name…
As I mentioned in my blog "Why Business Like Yours Choose Power BI Over SiSense", expect attack from other vendors to intensify as they find themselves fighting an increasingly uphill battle against Power BI. As we've seen, Power BI has indeed disrupted their sales cycles. In this blog, I'm reviewing the "10 Ways Power BI Falls Short" presentation that Tableau has published on their site. Tableau,…
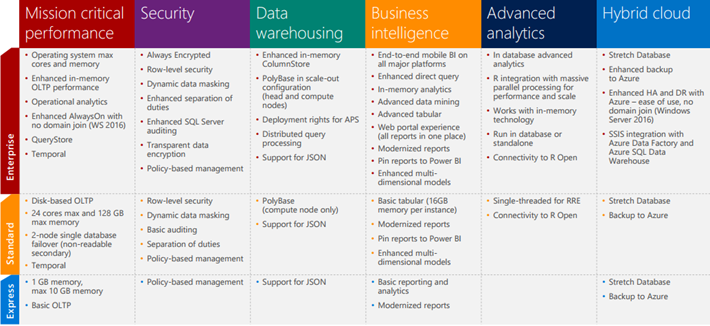
Microsoft announced that SQL Server 2016 will become generally available on June 1st. The BI edition is gone and I don't think that many people would miss it because of its client-based CAL licensing. I'd like to thank Microsoft of listening to feedback from MVPs and community and for including Tabular in Standard Edition! For more details, take a look at the SQL Server 2016 Editions…
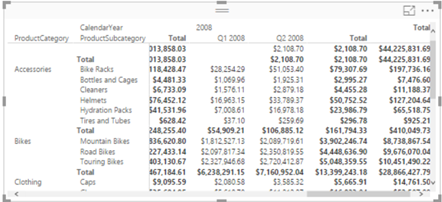
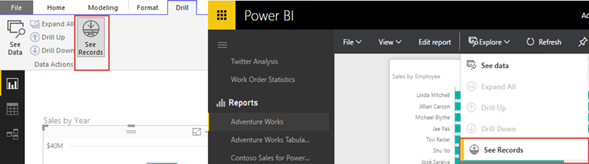
Excel users are familiar with drilling through details by double-clicking a cell in a PivotTable report or PivotChart data point. Power BI has silently added a similar feature to let users see the level of detail behind a chart data point in both Power BI Desktop and Power BI Service. This option can be enabled per visual by turning on the See Records option in…