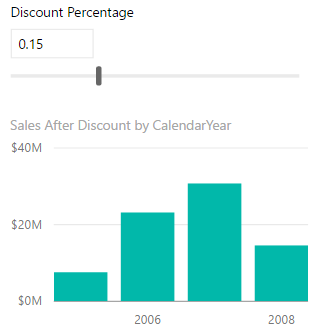
Veteran Excel users might have used the Excel What-if feature that let you try several different sets of values in one or more formulas to explore various outcomes (scenarios). The August release of Power BI Desktop introduces a similar feature. You start by defining a What If parameter from the Modeling tab. Don't confuse the What If parameter with a query parameter which is used…
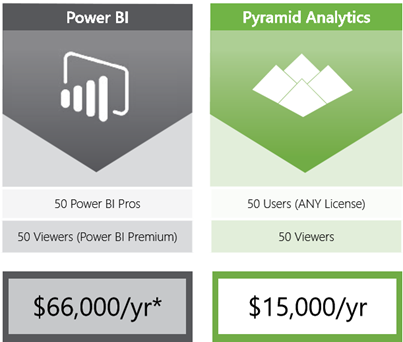
I've never thought I'd see this one coming but today I got a marketing email from Pyramid Analytics (previously an ardent Microsoft partner) citing a head-to-head comparison with Power BI. Et tu, Brute? "Let’s start with a clear pricing model – one that doesn’t require an online calculator to figure out annual costs. Let’s add in fundamental capabilities and features like dashboarding, KPI’s, dicing, time…
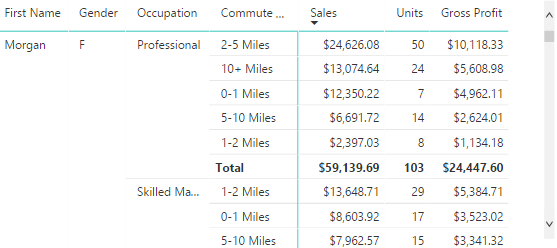
Related to the previous blog, let's show how to create a detail report in Power BI that mimics an Excel PivotTable report in a flattened layout. Consider the report below. To create it, use the Matrix visual and add the necessary fields to the Rows bucket and measures to the Values bucket. By default and similar to Excel, Matrix would use a Stepped layout so…
Nobody likes watching a report spinny. Interactive detail reports that perform well from an Analysis Services semantic layer have been the bane of my BI career. A "detail report" is a report that requests data at a lower level, e.g. policy in the insurance business, customer in Sales, etc. A detail report typically has many dimension attributes, eustomer Name, Account Number, Product Name, Product Number,…