Scenario: You have published a Power BI Desktop file with a report to Power BI Service. You want to give certain users access to some pages in the report. This is not a security mechanism although it could be, if you want to control security at the report layer. Solution: When a customer asked about this scenario, my first thought was to create reports directly…
Issue: You have a parameterized SQL Stored procedure that you want to call in DirectQuery mode. You attempt to use "exec sp parameter" syntax in the Power BI Desktop which works in the Query Editor but it fails to execute due to syntax error when you apply changes. Workaround: Power BI uses the "select * from exec sp" syntax which doesn't work. However, if you…
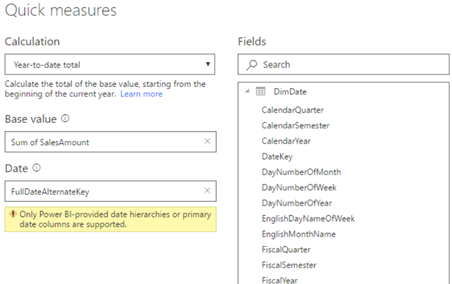
As I explained here, Power BI introduced the highly anticipated Quick Measures feature to avoid writing DAX formula for common measures. The feature is still in preview, so make sure you enable it in Power BI Desktop from File, Options and Settings, Options, Preview Features. Many quick measures, such as time intelligence calculations (YTD, QTD, Period Over Period Change, etc.), rely on a date field.…
So far, Power BI has lacked the ability to navigate to particular report element, such as another report page, and to allow you to show/hide visuals. For example, Tableau allows you to add buttons to pages and navigate to another page on button click. Such navigation capabilities are important for story telling and for emphasizing elements on the screen. This changes with the October release…
Scenario: A customer has implemented a Power BI model that retrieves data by calling the Dynamics CRM OData Feed endpoint. The dataset refresh operation is timing out. They want to increase the timeout setting but unlike connecting to SQL Server, where you can set the timeout duration in the source advanced properties, there is no UI for ODATA. Solution: If you open the query behind…
Can we surface Power BI reports deployed to Power BI Premium Report Server on mobile devices? Yes, and we have three quick options: Since Power BI reports render in HTML5, they should render in any modern browser. On iOS and Android devices, consider Power BI Mobile for optimum viewing experience. In Power BI Mobile, go to the Settings and click Connect to Server. Then plug…
How do you start a data warehousing project? Not much different than any complex software project. You break it down to small iterations, e.g. by subject area, design and implement each iteration from beginning to end, and deploy to deliver incremental value. Agile? Perhaps. In my career I've seen software methodologies come and go so I'd abstain from applying a label. The main goal is…
MS BI fans, join me for the next Atlanta MS BI and Power BI Group meeting on September 25th at 6:30 PM. Carlos Rodriquez and Daniel Granadillo from Brightstar will share their experience with Power BI and QlikView. Accelebrate will sponsor the meeting. And your humble correspondent will show you two new cool Power BI features: drillthrough to page and explain increase/decrease. Presentation: Did Qlik run out…
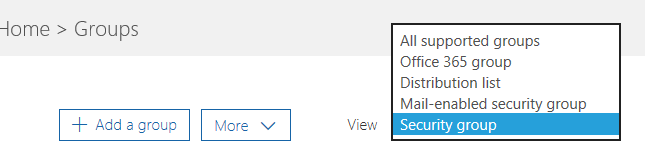
Power BI security is interwoven with Azure and O365 security. Sure, granting individual users access by entering emails works everywhere but it quickly becomes counterproductive with many users. For example, a large insurance company would like grant report access to 250 users and integrate this report with Dynamics 365. If you secure individually, this will require entering 250 emails three times: Dynamics 365, Power BI,…
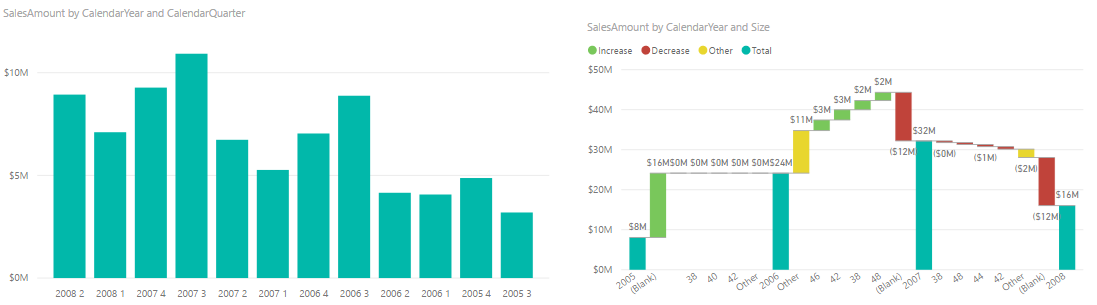
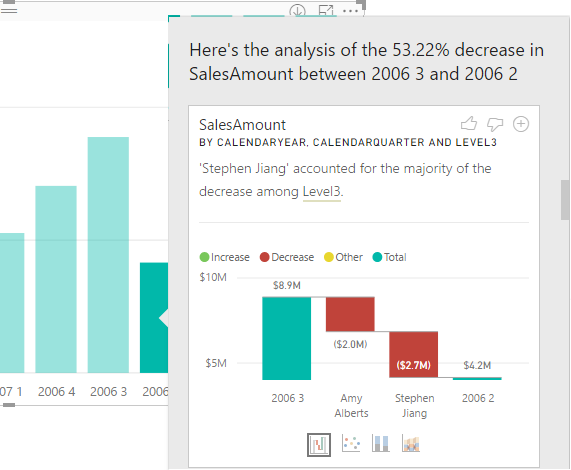
The September release of Power BI Desktop brings Quick Insights in the form of the very nice Explain Increase/Decrease feature (in preview). Suppose you have a column chart and you see a sudden increase or decrease in the chart series. You can now right-click on the bar and then click Analyze, Explain the Decrease menu. This runs the Quick Insights machine learning algorithms to predict…