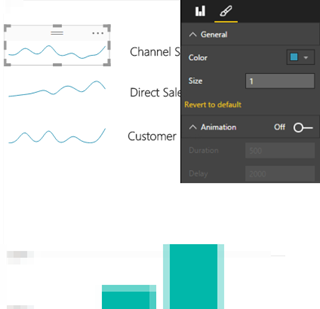
A sparkline is a miniature graph, typically drawn without axes or coordinates. Commonly used on dashboards, sparklines typically visualize trends over time, such as to show profit over the past several years. Although other Microsoft reporting tools, such as Excel and Reporting Services include sparkline elements, Power BI doesn't have one. That is until now. I contributed a "classic" sparkline custom visual to the Power…
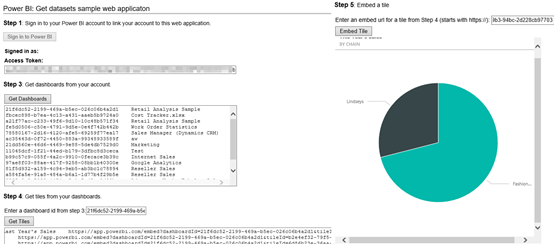
UPDATE: An updated sample is included in the Chapter 12 source code of my "Applied Power BI" book. One of the biggest Power BI strengths is its open architecture. In addition to opening the visualization framework, Power BI introduced REST APIs that let developers embed dashboard tiles in custom web applications (embedded reports will probably follow soon). Microsoft provided a sample application (Integrate-a-tile-into-an-app) on GitHub…
For years I've been harassing Microsoft to support embedding interactive reports connected to SSAS on custom apps. This feature has been sorely missing in the Microsoft BI stack. Yet, it's a must-have feature that enables a wide range of integration scenarios, such as customer-facing reporting. Imagine your customers being able to ask natural questions for data exploration. This is a killer feature! It looks like…
I'm happy to announce the availability of my latest training course – Applied Power BI Service. I believe that the new version of Power BI, known as Power BI Service or Power BI 2.0, is going to be very successful and it should warrant your serious interest. This one to two-day class is designed to help you become proficient with the Power BI Service and…
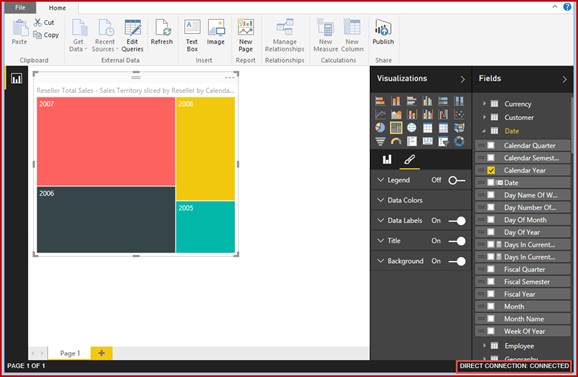
As you've probably heard the news, Power BI went live yesterday. Among the many new features, Power BI Desktop (previously known as Power BI Designer) now supports live connections to Tabular. This is conceptually similar to connecting Excel to Tabular or Power View to Tabular to create ad hoc reports. However, Power BI Desktop is a standalone and freely available tool that is independent of…
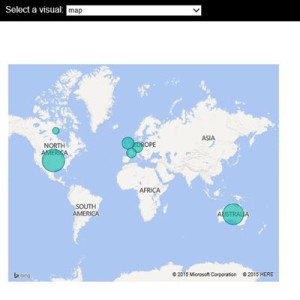
Today Microsoft announced the general availability of Power BI on July 24th meaning that Power BI goes live on that date. Among the many new features mentioned in the blog, the one that piqued my interest is custom visuals. Developers might recall that SSRS has provided custom report items since version 2005, which I wrote about in the October 2006 issue of the MSDN Magazine.…
I welcome every news about better visualizations in Microsoft BI so I rejoiced to read this blog by Ariel Netz, Group Program Manager in the Power BI Designer team. "The Power BI Designer team is working on our first update for the summer. That update will be significant, and will signal a new phase in our product development. To date we have mostly invested in…
As a continuation to my "Power BI vNext (let's now call it Power BI 2.0 to align terminology with Microsoft) SSAS Connector and Security" blog, you might wonder how Power BI provisions users. For example, if a user signs with his business e-mail and a coworker shares BI artifacts with him, what happens when the user leaves the company? Can he still gain access? As…
A customer wanted a bar chart where each bar shows the invoiced and realized sales and a marker to show a goal, as sketched below (notice the Budget marker). The chart had to render the data from SSAS. In SSRS, this of course can be done using a bullet gauge, which I hope one day will make its way to Excel and Power View. Because…
To follow up on my previous post on the same subject, a customer was eager to jump on the Power BI->On Prem SSAS bandwagon and try the simplified security model. But "omne initium difficile est" (every beginning is difficult). Their SSAS server was installed on a domain acme.com while their e-mail addresses were using a different scheme, e.g. user@contoso.com, although both server and accounts were…