
After a few years of extensive development and beta testing, Tableau announced its data preparation tool (Tableau Prep) for “redefining your data prep experience”. Previously, Tableau relied on other vendors, such as Alteryx, for self-service data preparation. Naturally, I wanted to take it for a spin and compare it with the Microsoft Power Query (available for free in Power BI Desktop and Excel), which has been around since January 2013. Power Query was initially introduced as an Excel add-on but now it’s available in both Excel and Power BI Desktop. For those of you pressed for time, here is the gist:
| Criteria | Power Query | Tableau Prep |
| Price | Free | $70/user/month for Creator bundle |
| Integration | Integrated with Power BI and Excel | Stand-alone (with preview in Tableau Desktop) |
| Prepackaged Connectors | 70 | 26 |
| Custom Connectors | Yes | No |
| Row-level transformations | Keep rows, remove rows, remove duplicates, promote headers, group by, merge, append, pivot, transpose, combine files | Pivot, join, union |
| Column-level transforms | Copy, remove, duplicate, column from example, calculated column, remove, remove duplicates, remove errors, change type, rename, transform (lower, upper, trim, etc.), replace values, replace errors, split column, index column, group by, fill, pivot, move, format, extract, number column (statistics, standard, scientific, math), date and time column, R script | Filter (formula required), group and replace, clean (upper, lower, trim, remove characters), split, rename, remove, calculated field |
| Interactive graphical step flow | No (static Query Dependencies diagram) | Yes |
| Parameters | Yes | No |
| Use R for data prep | Yes | No |
| User-created tables | Yes | No |
| Detect and expand relationships in data source | Yes | No (one data source at the time) |
| Functions (to centralize common logic) | Yes | No |
| Script (all transformations in one place) | Yes | No |
| Calculation language | Power Query M language | Tableau calculation language |
| Output destination | Directly into PBI data model, Excel sheet (Power Query in Excel only) | Save as TDE, Hyper, CSV, preview in Desktop |
| Output options | One table in the model per query (typically) | One output from Tableau Prep file (Tableau model can’t handle multiple tables) |
It’s clear that Tableau Prep is far behind the Power Query capabilities and has a lot of catching up to do. I took Tableau Prep for a quick ride to do simple data prep. The goal was to cleanse the geo table in the bi_dimensions Excel file that Microsoft provides as sample data for Dashboard in a Day (DIAD) workshops.

The geo table has a small (but common) issue because it has some extra rows that appear before the main dataset. These rows needs to be removed and the labels in the forth row needs to be promoted as column headers. Simple right?
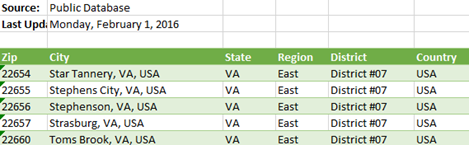
In Power Query, you can quickly filter out top or bottom rows. No formulas or functions required. There wasn’t such a feature in Tableau Prep. I had to use a column filter (requires an expression) to filter out the top three rows. So much about “a drag-and-drop visual experience” and “no scripting required”. I also couldn’t find a feature to quickly promote column headers. In my opinion, Power Query is by far more user friendly than Tableau Prep.
After enough wrangling to do what’s simple in Power Query but complicated in Tableau Prep, I wanted to save the results. In Power BI Desktop and Excel, you can conveniently load the transformed data directly into the data model. Then, to reflect the changes in the data source, such as when you get a new file with the same spec, you just refresh to re-import and transform the data. No such integration with Tableau Prep. It’s designed to run the flow manually. And to me the biggest limitation of the tool, which stems from the limitation in the Tableau modeling capabilities, is that everything falls apart when you need multiple tables in your data model. Tableau’s mentality remains “one dataset at the time”.
I’ve noticed people excited about the Tableau Prep graphical interface. While it does help visualizing the flow I’m not sure how much value it really adds given that the steps are sequential, and the tool doesn’t support conditional constraints and branches. But you have pretty icons…without much behind.
While testing the tool, I couldn’t help but ask myself “Why pay hundreds of dollars per user/per year for Tableau Creator when Power BI Desktop is better and free?”
I shared more thoughts about Tableau vs Power BI in my blogs Power BI vs. Tableau (Part 1), Power BI vs. Tableau (Part 2), Power BI vs. Tableau (Part 3), and Tableau Hyper vs. Power BI xVelocity. As usual, I welcome your comments. Tableau fans are welcome too.



Nice.
How about connect to On-Premises Data Sources ?
I use to connect my SQL Server in my office from Power BI Desktop, Power BI Service with on-premises data gateway.
Nothing has changed about this in Power BI. I see that Tableau Prep can connect to the most popular on-prem servers too.
Thank you for your quick reply and for your information
Nice post!
Aren’t web data connectors the the equivalent of custom connectors in Tableau? Sadly, these are not integrated with Tableau Prep yet, but I can imagine that at one point they will be since the connector is already available through the Tableau Desktop
I would add that the Output Destination in Power Query can be an Excel table (so it can be saved as an Excel or CSV file) using Power Query in Excel.
You are correct, but that is some work around. And you have to use Power Query in Excel, while the Query editor in PBI Desktop typically has the latest features. It seems to me the only advantage Tableau Prep has is that it can save to CSV, which makes it a stand-alone tool to do data prep (for example for prepping data for machine learning). But the price of Tableau Prep is … ehrm… high. With that money you have 7 users in Power BI Pro, with all of the features.
Yes, it will be nice to have an output destination in Power Query
Pricing playes a major role, and if we are open for higher cost, we shall also consider below features.
1- Online power query for Power BI dataflow and later using that via direct query, even the actual input is Excel CSV or anything(yes direct query for excel data source)
2- power query can also be used into data factory pipeline.
3- transformation using AI capabilities (text analytics, vision analytics and cognitive services).
4- you can run the machine learning algorithm on entities of Power BI dataflow which were created using online power query transformations.
5- most important, if something is not there by default, M code is there to help like custom connectors, or other data transformation, running Python and R for data transformation.
Overall if we only talk about Power Query and tableau prep I think there is no comparision between these two.
Good point, Marco. I updated the table to include this option.
Nice comparison
Did you try Data Interpreter to clean the Geo dataset?
I am not sure if it is available in Tableau Prep, but it is available in Tableau desktop, and Public versions.
“Why pay hundreds of dollars per user/per year for Tableau Creator when Power BI Desktop is better and free?”, I always asked the same question till I started working in a company where Tableau is the official BI solution, now I kind understand why tableau is attractive in some scenarios. to answer you question is simply because of Tableau reader.
In tableau ecosystem, you need only one license of Tableau desktop, once the dashboard is done, you simply distribute the file to any numbers of users, they can open filter interact and most importantly print. we can’t do this with PowerBI desktop, because it is designed to be an editor not as a standalone BI solution.
and yes data modelling in Tableau is very limited compared to PowerBI or even Qlik for that matter, but we can always use different approach, like blending or simply creating a large Fact table with all the dimensions, even with different angularities.
Thanks for the feedback. Help me understand this better. I’m sure you know that Power BI Desktop is free and you can distribute *.pbix to any user for free. So file sharing is free with both Power BI Desktop and Tableau Reader. Do you see then Tableau Reader being a better option because it doesn’t allow the recipient to make changes to the content? Of course, if the recipient has Tableau Desktop they can open the file and change it any way they want so you don’t use Tableau Reader as a security feature, right? If the above is correct, I’m not sure why having a free tool that lets you change the content is worse than having a feature-limited “reader”.
for the record, although my company use Tableau, I use PowerBI desktop :), my manager see a PDF and that’s all what he care about.
the reason distributing pbix is not an option is the lack of printing, it is a showstopper, and PowerBI desktop has no viewer mode for example locking object does not save, the view mode is only available in the service, it is not a complain,Microsoft has to make a living somehow.
so Tableau viewer is a better option because it is read only and designed for that purpose. it is not about security, it is making the experience usable for end user.
I see. Yes, printing is long overdue. I see that print to PDF is planned for June for Power BI Service and Embedded. I hope it makes it to Power BI Desktop. It’s one of the most voted features (https://ideas.powerbi.com/forums/265200-power-bi-ideas/suggestions/10003632-print-option-from-power-bi-desktop). Might want to report “Lock Objects” on save as a bug. It should be preserved on save. Vote for it also here (https://ideas.powerbi.com/forums/265200-power-bi-ideas/suggestions/32218330-allow-save-the-lock-objects-option-for-each-proj).
I voted for both ideas, but I suspect, it is not a bug but a deliberate decision, the business model is clear, the designer is free, but any convenient consumption of the reports has to be done either in the paid service or PowerBI report server.
again, it is not a complain, I am grateful that we have the PBI desktop, taking screenshot is a small inconvenience for a free product.
Precisely. Microsoft BI has its problems but somehow I don’t think that these two features are missing on purpose to prevent report consumption. If they were after profit, they would come with a “reader” 😉 to limit features.
all companies are after profit, let’s not forget the removal of sharing from the free tier :(,
competition is good for users, I wish that Tableau step up it game, specially the data modeling, if only they add a proper dimensional modeling !!
I exchanged notes with Microsoft on the “reader” concept. While there are no plans to invest in “reader” features as Microsoft has given Desktop for free, Microsoft has promised desktop printing. In fact, in the wish discussion thread at https://bit.ly/2raq0fD, Microsoft said “Print has risen to the #1 ask from the community and we are taking it as such. We have cleared some significant technical challenges that blocked the implementation and we can now start addressing it. It is not a simple feature but we are committed to deliver it by summer.”
I guess this will share the same code base with Print to PDF in Power BI Service (also targeting Summer 2018).
Of course if you really think about what these tools are for – printing is no the intent. They are best used to produce dynamic data visualisations viewed within the applications – if you embrace that and change the mind-set then you won’t miss printing at all.
This blog does a great job of showcasing the advantages of Tableau Prep . Very useful for both beginners and experienced users!