
Ask a business user where they want to work with the data, and Excel would probably top the list. Regardless of how hard we try to lure users away from it, Excel remains the endpoint of self-service BI for many organizations. I have clients who have built custom apps or purchased Excel add-ins simply to get data into Excel—or manipulate it once it gets there.
So rather than fighting Excel, let’s look at the options Microsoft provides for bringing governed Power BI data into it. In particular, I’m interested in getting data from Fabric semantic models into Excel.
Many things have changed over the years in the data analytics space, but semantic models have stood the test of time. The technology has changed—from multidimensional OLAP cubes to tabular models and now Power BI and Fabric semantic models—but the basic idea has remained remarkably consistent: put business logic and governed data in a centralized model, then let different tools consume it.
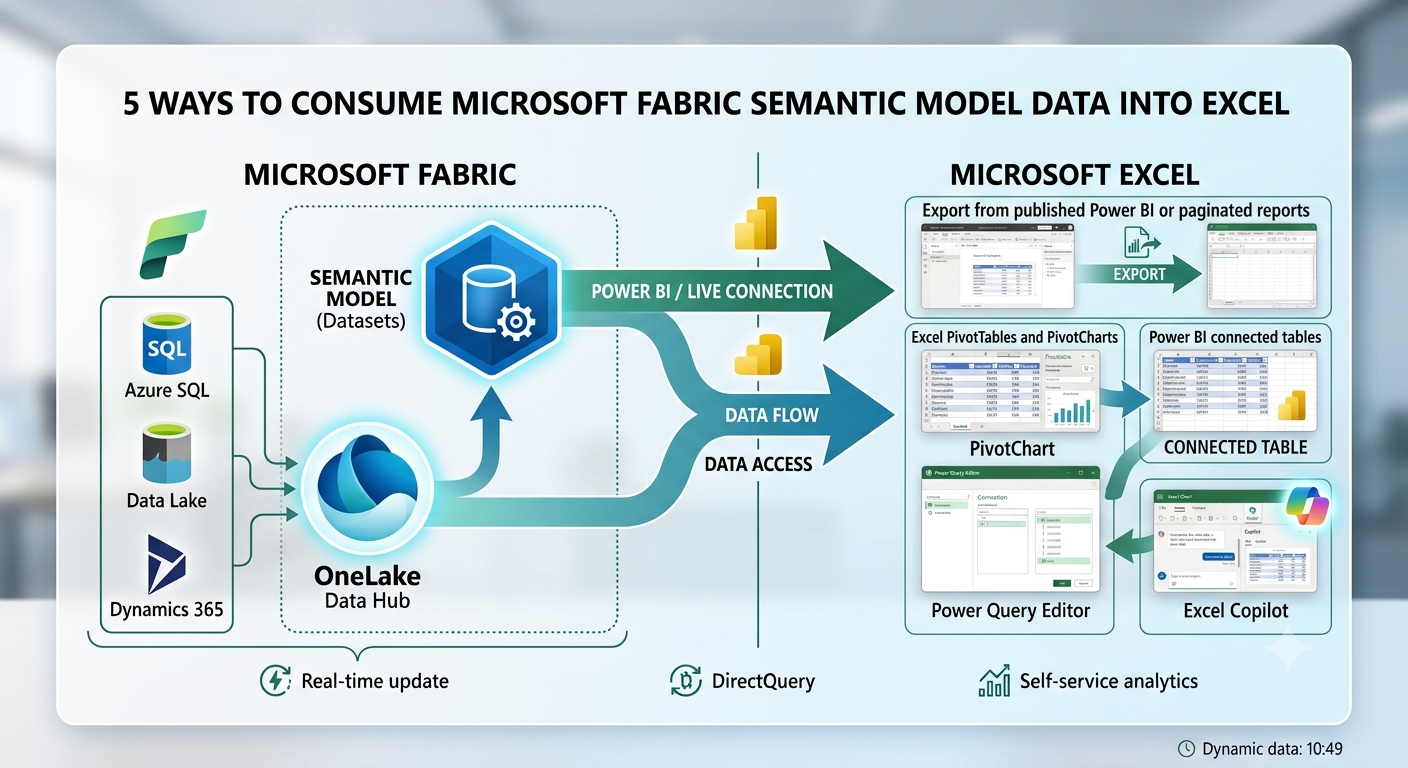
Here are the main options Microsoft provides today to make data from semantic models available in Excel:
| Option | Pros | Cons |
| Export from published Power BI or paginated reports | Power BI collaboration features; sharing; subscriptions; dynamic subscriptions; familiar report experience | Export limitations; additional effort to create reports just to get data into Excel |
| Excel PivotTables and PivotCharts | Familiar reporting experience; live connection to semantic models; customizable drillthrough; ability to share Excel reports in Power BI Service and generate them online; OLAP formulas | Outdated report experience; MDX query interface; rigid report layout; Excel workbook must be shared; must open report from OneDrive/SharePoint to interact |
| Power BI connected tables | Data is delivered directly into an Excel table; designed specifically for Power BI semantic models; good UI for selecting fields and filters | Less flexible than a full report; users don’t get the full Power BI report experience |
| Power Query | Transform data; mash up multiple data sources; reusable queries | Suboptimal MDX queries, additional complexity; connector limitations; licensing/connection considerations |
| Excel Copilot | Natural-language instructions; can retrieve and augment data; can transform data | Still evolving; can be slow; not yet ideal for creating a reusable library of data-extraction definitions |
Export from published reports
This is probably the most obvious option. A Power BI or paginated report can serve as the interface for users, with Excel being the ultimate destination. This approach can be particularly attractive when the organization wants to take advantage of everything Power BI has to offer: report sharing, subscriptions, dynamic subscriptions, annotations, and other collaboration features.
For example, a report can be designed specifically for a group of users and distributed through a subscription. Paginated reports provide even more flexibility when the objective is to produce formatted Excel or CSV files on a recurring basis.
The problem is that Power BI report exports have limitations. Depending on the report and export method, there are limits on the amount of data that can be exported. Paginated reports are considerably more flexible for large-scale tabular output. There is also an architectural question: do we really want to build a Power BI report whose primary purpose is to get data into Excel? If the report exists only because Excel is the final destination, we’re arguably using the report layer as an unnecessary intermediary.
The better architecture is often: Semantic model → Excel rather than: Semantic model → Power BI report → Excel
Excel PivotTables and PivotCharts
Excel has supported PivotTables since the 1990s and OLAP PivotTables for more than 25 years. This is hardly new technology. And that’s part of the appeal. The experience is familiar to generations of Excel users. A user can connect to a Power BI semantic model, select fields, slice and dice the data, and create PivotTables and PivotCharts without building a Power BI report.
The problem is that the fundamental PivotTable interaction model has changed surprisingly little. Slicers and timelines improved the experience, but the overall model still feels much closer to the Excel/OLAP world of the early 2000s than to today’s Power BI experience. As such, it generates suboptimal MDX queries although not as bad as Power Query in import mode.
For an Excel user, however, there is one particularly interesting capability: customizable drillthrough. When a user double-clicks a PivotTable cell, the semantic model can provide a detailed table of the underlying records. A semantic-model developer can control this behavior using the measure’s Detail Rows Expression, which can return a table-producing DAX expression. This is a powerful capability when the semantic model has been designed with Excel users in mind.
Another useful feature could be converting pivots into OLAP formulas. This gives finance professionals the precise, cell-by-cell control they need to build tailored financial reports.
There is a catch, though. If you are developing a semantic model that must support both Power BI and Excel users, you need to design for the least common denominator. Excel’s live-connection experience does not expose all the capabilities available in Power BI reports. For example, there are differences around field parameters, some filtering scenarios, custom visuals, and metadata behavior. Even seemingly small modeling decisions can affect how the semantic model appears in the Excel Field List.
In other words, a semantic model that works beautifully in Power BI isn’t necessarily going to provide the same experience in Excel.
Power BI connected tables
This is the option that could have the most potential if it wasn’t another half-baked Excel reporting feature. Microsoft introduced connected tables in 2023, but the experience has evolved considerably since then. Excel can now discover Power BI semantic models directly, and users can choose to insert either a PivotTable or a Table from the semantic model.
The Table option is particularly important because it delivers the data in the format most business users actually want: an Excel table. The user can select the fields they need and apply filters through a dedicated interface, rather than having to write DAX or build a Power BI report first. This is a significant improvement over the traditional export experience.
For years, the missing piece in the Microsoft BI stack was obvious: Excel users wanted the flexibility of a PivotTable’s field-selection interface but wanted the result as a regular Excel table. Connected Tables finally moves in that direction. It is also a much better architectural model: Fabric semantic model → Excel table. There is no Power BI report in the middle.
On the downside, the user interface is lost once data is exported. Consequently, the user must change the underlying DAX query (a client immediately dismissed this option after learning about this) if they want to make changes, such as adding additional fields. This could be a great option if there is a way to bring back that interface. Even better, let the user pick fields from Field List as they can with pivots but export to a table. What could be simpler?
Power Query
Another option is hiding in Excel’s Get Data experience. Power Query can connect to Power BI semantic models and provides considerably more flexibility than a simple connected table. Once the data is retrieved, users can transform it and even mash it up with other sources. For example, a user could combine:
Power BI semantic model + Excel file + another data source → Power Query → Excel table
It also makes Power Query a compelling option when the requirement isn’t simply “show me this data,” but rather: “Get this data, transform it in these ways, combine it with my other data, and give me a reusable result.”
The biggest issue we faced with this option was performance. For reason unknown, in import mode the Analysis Services connector generates horrible MDX queries, with nested CROSSJOINs, one for each imported field. This was another showstopper for us. In addition, Power Query is a data-transformation tool, not a simple business-user reporting interface. Users must understand queries, transformations, refresh, data sources, and credentials. Excel’s Power Query implementation also doesn’t expose every connector and capability available elsewhere in the Microsoft data platform.
So, while Power Query is powerful, it isn’t necessarily the best answer for a business user who simply wants to select a few fields from a semantic model.
Excel Copilot
And, of course, there is AI. I’ve personally found Excel Copilot very useful for tasks such as generating test data, transforming data, and working with existing spreadsheets. Microsoft is now taking this a step further by integrating Power BI data into Copilot in Excel. The new Power BI grounding capability allows Copilot to use governed Power BI data when answering requests in Excel. This is potentially a very different way of interacting with a semantic model.
Instead of teaching a user how to navigate a Field List, write DAX, or configure a Power Query, the user can simply say what they want.
For example: “Bring me revenue, margin, and customer name for the current fiscal year. Filter to the Southeast region and sort by revenue descending.”
That’s exactly the type of task for which natural language makes sense. The technology is still rough around the edges, though. The experience can be slow, and the interaction isn’t yet ideal for creating a reusable library of data-extraction definitions. A prompt that works for one user isn’t necessarily a well-defined, portable query definition that another user can reuse with predictable results.
For Copilot to become a serious enterprise data-extraction mechanism, I’d like to see prompts evolve into something more like shareable, governed query definitions—something a business analyst can create once and distribute to other users.



JOIN THE CONVERSATION
Discussion