
In my last post, I ranted about Excel connected tables backed by Power BI semantic models. For years, I’ve heard from clients that all they wanted was to dump query results into regular Excel tables so they could use standard formulas. Connected tables achieved this using DAX instead of MDX for faster queries—except clients still wanted those tables to be interactive, just like PivotTables.
On the downside, the user interface is lost once data is exported. Consequently, the user must modify the underlying DAX query—an option a client immediately dismissed after learning about it—if they want to make changes like adding additional fields. This would be a great option if there were a way to bring that interface back. Even better: let users pick fields from a Field List as they do with pivots, but output directly to a table. What could be simpler?
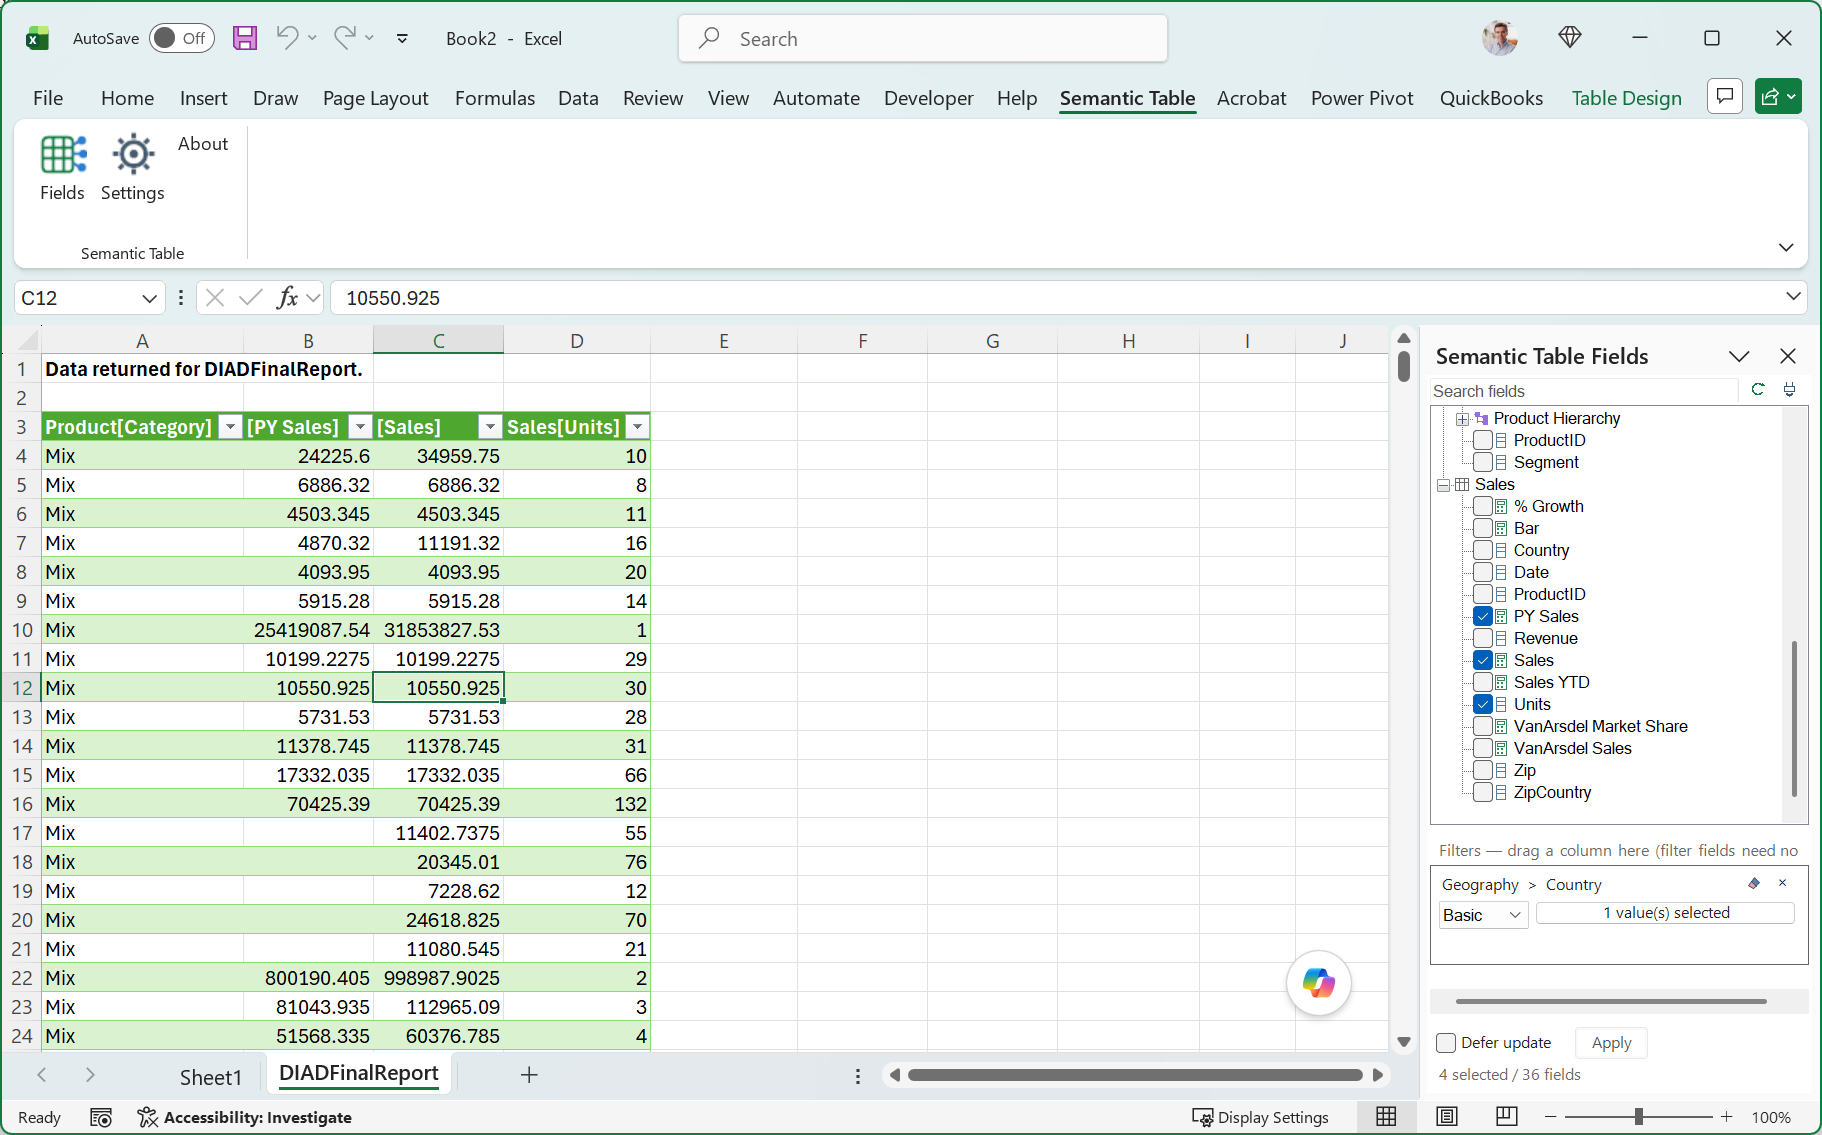
It dawned on me that while waiting on Microsoft, I could fill these gaps myself by creating an Excel add-in. That is how the Semantic Table add-in was born. It picks up right where default connected tables leave off.
Others have already explored this path, such as Jörg Schmidt with his PBIXL add-in. However, I’ve taken a different implementation approach focused on these core features:
- Flexible Integration: Supports both existing connected tables (created using Microsoft’s Insert Table) and tables built from scratch.
- Field List UI: Provides a familiar PivotTable-like Field List directly within the table context.
- Dual Execution Modes: Supports both Deferred Mode (apply updates manually to prevent constant re-querying) and Interactive Mode (live field updates).
You can download the Semantic Table add-in directly from the GitHub Repository. I hope the community finds it useful, and I’m looking forward to your feedback.
Fair warning: the add-in is likely as buggy as Atlanta in the summer, so use it at your own risk!



The GitHub Repository link takes me to a Google search page? I'd love to give this a try. I just noticed that it DOES have Filter abilities.
P.S. I found the link from the LinkedIn page: https://github.com/thracian2015/SemanticTable
Hi, this is the correct link so not sure what's with the Google search page. There are videos on the Github landing page to learn more about the add-in. The direct link to the add-in releases is https://github.com/thracian2015/SemanticTable/releases . If you have any issues, please post them to the GitHub Issues page.