The Future of Microsoft Logical Data Warehouse

Let’s face it, the larger the company, the more difficult is to achieve the dream of single enterprise data warehouse (EDW). In a typical mid-size to large organization, data is found in many data repositories and integrating all this data is difficult. I’m doing an assessment and strategy engagement now for a unit in a large organization, and they need access to at least 10 other on-premises systems, including two very large repositories. Naturally, they don’t want to import all of this data, which could be millions of rows per day, and recreate their own copy of these large corporate repositories. So what to do?

In my “QUO VADIS DATA WAREHOUSE?” newsletter, I defined a logical data warehouse (LDW), also known as data virtualization, is an emerging technology that allows you to access the data where it is. Don’t we have linked servers in SQL Server that do this? We do and they might work to a point. But what if you want scale out distributed queries to achieve better performance? In today’s SQL PASS SUMMIT keynote, Day 1 Keynote “A.C.I.D. Intelligence” (A.C.I.D stands for Algorithms, Cloud, IoT, Data), Rohan Kumar showed something that I think it’s very important and it deserves much more attention than occasional references in blogs. It showed where Microsoft is bringing PolyBase and how this technology could be the Microsoft implementation for data virtualization.

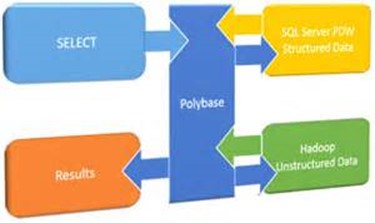
In SQL Server 2016, PolyBase allows you to access data in on-premises Hadoop cluster and in Azure Blob Storage. For example, you can store some files in HDFS and define an external PolyBase table. Then, you can have a query with heterogeneous join between a local SQL Server table and the external table. Rohan showed that Microsoft will extend PolyBase to other popular SQL and NoSQL databases. More importantly, it showed that just like an MPP appliance, such as Microsoft Analytics Platform System (APS) or Azure SQL Data Warehouse, a SQL Server node would allow you to combine multiple SQL Server instances as compute notes so that you scale out access to these data sources. For example, if you have two SQL Server compute nodes and you use PolyBase to access an Oracle database, you’ll be essentially spreading the query across these nodes in parallel and then combine the results. Of course, just like linked servers, there are technical challenges, such as cases where SQL Server might need to move data to the other node. Rohan mentioned that the SQL Server query optimizer will have smarts to optimize heterogeneous joins.

If you’re in the market for a logical data warehouse vendor, don’t rule out Microsoft. Stay tuned for more news around PolyBase and the investments Microsoft makes in this area after the Metanautix acquisition.

Power BI Dashboard in a Day (DIAD) for SQL Saturday BI

I’m doing a full-day Power BI Dashboard in a Day (DIAD) for SQL Saturday BI on Friday, December 9th for only $129. I’m also sponsoring the event and presenting “Embed Interactive Reports in Your Apps” presentation on Saturday at 9 AM.

SQL Saturday Atlanta BI Edition is proud to announce this full day training, register at https://powerbidiad.eventbrite.com today!

Power BI Dashboard in a Day (DIAD) is a one-day training designed by Microsoft to accelerate your Power BI experience with a comprehensive training program in a single day. All you have to do is bring your Windows-based laptop and we’ll supply the rest – even lunch! With DIAD you get practical hands-on training prepared by the Microsoft Power BI team. During this precon we’ll build a Power BI dashboard together. Along the way, you’ll learn:

• How to connect to, import & transform data from a variety of sources
• Build real data models, as well as author and publish Business Intelligence reports
• Customize and share your “creations” for collaboration with other groups securely inside your organization including mobile device sharing
• Get your Power BI questions answered

Reserve your seat now to and witness the value Power BI can deliver to you and your organization!

Azure Analysis Services

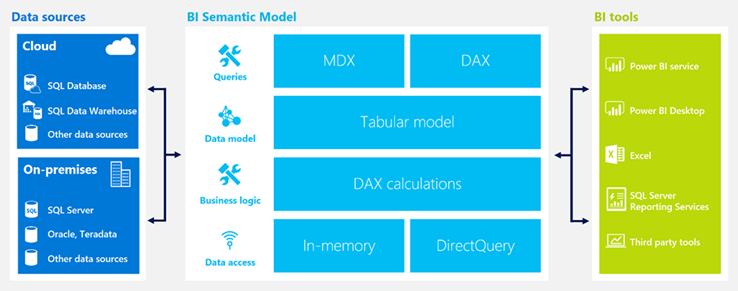
Despite the mantra you might hear elsewhere, my experience shows that the best self-service BI is empowering users to create reports from trusted semantic models sanctioned and owned by IT. Most of the implementation work I do involves Analysis Services in one form or another. Analysis Services has a very important role in your BI ecosystem as I explain in the “Why Semantic Layer” newsletter.

Today, at the SQL PASS SUMMIT, Microsoft announced that Analysis Services Tabular is now available as an Azure PaaS service. As a participant in the prerelease program, I had the opportunity to test Azure Analysis Services and this is why I believe you should care:

  1. If you develop cloud-based solutions, you might not have to provision a VM for Tabular anymore. Instead, you can provision an Analysis Services cloud service in seconds, just like you can provision an Azure SQL Database.
  2. You can easily scale up or down Azure Analysis Services, just like you can do this with Azure SQL Database. You can even pause it so that you don’t incur cost.
  3. You don’t have to set up a gateway for SSAS. You can use Power BI Desktop to connect to Azure Analysis Services and deploy the report to Power BI. However, you would need a gateway if your source data resides on premises so that you can process the model with on-premises data. Note that currently you can’t use Power BI Get Data to connect to Azure Analysis Services directly from Power BI. Instead, you must use Power BI Desktop.
  4. The service is highly available by default. SQL Server pros implementing highly available solutions know that this is not easy and not cheap. So, factor in high availability if you find Azure Analysis Services pricing is too high.

On the downside, as it stands Azure Analysis Services uses Azure Active Directory for security and it doesn’t support claim authentication. Power BI users will be able to authenticate but not Power BI Embedded (not yet).

Currently in preview, Azure Analysis Services is a very important addition to the Microsoft Azure BI stack that allows BI pros to implement cloud-based semantic models as they can currently do on premises.

102616_0114_AzureAnalys1.png

Automating Power BI Desktop Refresh

Power BI Desktop is becoming an increasing popular tool for self-service reporting. But it has a glaring gap. Unlike Excel, it doesn’t currently support an object model for automating tasks. Yet, there are a variety of scenarios that call for task automation, such as refreshing imported data. For example, one customer wanted to show a Power BI Desktop dashboard on a shared monitor that will refresh itself periodically. In another scenario, an ISV wanted to automate the data refresh because Power BI Embedded doesn’t currently have APIs to support a scheduled refresh.

Currently, there is no supported way to refresh Power BI Desktop files automatically. However, you can try the following approaches at your own risk:

  1. Use the Michal Dúbravčík’s PBIXRefresher script. This is a PowerShell script that opens Power BI Desktop and sends a key to the Refresh button.
  2. Shell out to open Power BI Desktop with the file you want to refresh (pbidesktop.exe <filepath to pbix file>). Then, find programmatically the port that the PBI SSAS listens on (see my “Upgrading Power BI Desktop Models to Tabular” blog on this subject). Then, use AMO or the new Tabular Object Model to send a process script command.
  3. Use the commercial Power Update tool, which is capable of refreshing Excel Power Pivot workbooks and Power BI Desktop files.

A Glimpse of Embedding Power BI Reports in SSRS

The first public demo of the highly anticipated Power BI report embedding feature in SSRS 2016 on premises came from Microsoft Ignite. Scroll to the 58 minute in the Ricardo Muti’s “Create a modern enterprise reporting and mobile BI solution with SQL Server 2016” video and enjoy! I expect more details at SQL PASS SUMMIT at the end of this month. Thanks to Dan English for pointing out this video.

100716_0242_AGlimpseofE1.png

Power BI Adds Time Series Forecasting

The September update of Power BI Desktop adds one of the most requested features – time series forecasting on single line charts. You can control the confidence interval and seasonality. To use forecasting, make sure that you add a field of Date data type to the chart axis.

100116_2012_PowerBIAdds1.png

Only when a date field is used, then you’ll see the Forecast section added to the Analytics pane.

100116_2012_PowerBIAdds2.png

Presenting at Atlanta Code Camp 2016

I’m presenting Power BI Embedded at Atlanta Code Camp on Saturday, October 15th.

You have the app. You have the data. What if your app could put the power of analytics everywhere decisions are made and allow your customers to gain insights? Modern apps with data visualizations built-in have the power to inform decisions in context—for any user and on any device. Join me to discover how you can embed data analytics in any app and on one device powered by Azure and Power BI Embedded.

I’ll share my experience in helping customers embed Power BI reports. Learn how to:

  • Create compelling interactive reports
  • Embed easily for faster time to value
  • Deploy quickly and manage with ease
Find the slides in these locations:
1. This site

MVP for 13 Years!

Microsoft awarded me again with the Most Valuable Professional (MVP) Award for Data Platform. This is a prestigious annual award given to selected individuals in recognition for their expertise and contribution to the community. There are 387 Data Platform MVPs worldwide and 92 of them are in the United States. his makes it 13 consecutive years for me as Data Platform MVP!

mvp_logo_horizontal_secondary_blue286_rgb_300ppi

Power BI Nested Hierarchical Labels

In the latest Power BI Desktop update, Power BI introduced a new drill-down option. Previously, after enabling drill-down on a chart and clicking the double-arrow icon, the chart will drill down to the next field in the Axis area (or to the next level of a hierarchy if a hierarchy is added to the Axis area). A student attending my Power BI class asked me this week how to avoid aggregation across all years if the user drills down from Year to the Month level. A few days ago, the only option was to introduce another Month field that has the Year-Month combination, e.g. 2005 July, 2005 August, and so on. Now, with the new drill down style, the chart will nest the hierarchical levels so you don’t have to add a new field. This behavior is similar to how Excel show categories nested in PivotChart.

Atlanta MS BI Group Meeting on September 26th

MS BI fans, join me for the next must-attend Atlanta MS BI and Power BI Group meeting on September 26th at 6:30 PM. The Microsoft Ignite conference takes place this year in Atlanta, starting on Sep 26th. Kamal Hathi (General Manager for Power BI at Microsoft) and Pratap Ladhani (Sr. Program Manager at Microsoft) will be in town for Ignite and we will present at our meeting! This is a must attend session for everyone using or planning to use Power BI. Join us and learn why Power BI enjoys such a tremendous success and where Microsoft is planning to take it. Enjoy catering by Subway, thanks for Microsoft sponsoring this event.

Presentation: Power BI at one year – a look back and a look forward 
Level: Beginner
Date: Monday, September 26th, 2016
Time 6:30 – 8:30 PM ET
Place: South Terraces Building (Auditorium Room)
115 Perimeter Center Place
Atlanta, GA 30346
Overview: This is a must attend session for everyone using or planning to use Power BI. With weekly and monthly releases, there are a lot of fantastic new features to explore in Power BI. In this session we will cover an overview of what has been released in Power BI across PowerBI.com, Power BI Desktop, mobile apps and APIs. You’ll also discover what’s new and exciting in Power BI. In this session, we’ll also introduce PowerApps – a new product from the Power BI engineering team which enables non-developers to create & use custom applications & forms across all platforms (iOS, Android, Windows & Web).
Speaker: Kamal Hathi is a General Manager for Power BI at Microsoft and a co-founder of Microsoft’s multi-billion dollar Analytics and Business Intelligence products. Kamal has delivered Power BI to market, and was responsible for its end-to-end strategy, design and delivery. Kamal is currently responsible for product growth and success of the Microsoft Business Application Platform.

Pratap Ladhani is a Sr. Program Manager at Microsoft focusing on Customer & Partner success for PowerApps and Microsoft Flow. He has been working with Microsoft for more than 13 years and has spoken earlier at Build, TechEd, Convergence & WPC conferences.
We expect other speakers from Microsoft to join us too.

Sponsor: Microsoft