Atlanta BI fans, please join us onlinefor our next meeting on Monday, July 6th at 18:30 ET. James Serra (Data & AI Solution Architect at Microsoft) will show you how AI can transform our interaction with structured data, providing practical applications for enhanced automation, decision-making, and efficiency in data analysis. For more details and sign up, visit our group page.
Delivery:Online via MS Teams Level: Beginner/Intermediate Food: Pizza and drinks will NOT be provided
Agenda:
18:30-19:00 Organizer time (events, news, sponsor marketing)
19:00-20:15 Main presentation
20:15-20:30 Q&A
Overview: Generative AI, traditionally used for processing unstructured text, is rapidly advancing to handle structured data like relational databases, spreadsheets, and CSV files. New tools now enable AI to extract meaningful insights, identify patterns, and generate predictions from structured datasets. This presentation will explore how AI transforms our interaction with structured data, providing practical applications for enhanced automation, decision-making, and efficiency in data analysis. I will discuss ChatGPT, Copilot, and Microsoft Fabric Data Agents and provide a level-set on GenAI definitions, RAG, fine-tuning, and cover industry use cases for using both unstructured and structured data to make better business decisions.
Speaker: James Serra works at Microsoft as a data solution engineer where he has been for most of the last twelve years. He is a thought leader in the use and application of Big Data and advanced analytics, including data architectures such as the modern data warehouse, data lakehouse, data fabric, and data mesh. He has over 40 years of IT experience. He is a popular blogger ([JamesSerra.com](https://www.jamesserra.com/)) and speaker, having presented at dozens of major events. He is the author of the book “Deciphering Data Architectures: Choosing Between a Modern Data Warehouse, Data Fabric, Data Lakehouse, and Data Mesh”.
https://prologika.com/wp-content/uploads/2016/01/logo.png00Prologika - Teo Lachevhttps://prologika.com/wp-content/uploads/2016/01/logo.pngPrologika - Teo Lachev2026-06-30 16:15:342026-06-30 16:15:34Atlanta Microsoft BI Group Meeting on July 6th (Using Generative AI on Structured Data)
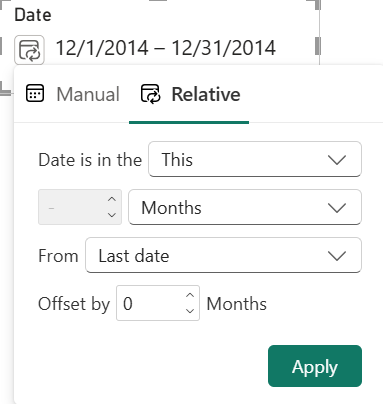
The June release of Power BI Desktop includes a preview of a new Power BI slicer configuration – Date Picker. It’s meant to solve two issues with report design.
The first one is letting the user select a single date by configuring the Date Picker using the Manual selection. Yes, it took a decade, so we must appreciate the engineering effort to get this implemented, so we don’t have to rely on workarounds as Patrick explains here.
More importantly, it helps with filtering the “current” period, so the end users don’t have to change filters when the calendar rolls forward. Previously, we had to resort to overwriting the current period caption, such as renaming the current month to “Current”, so the slicer automatically rolls forward when the current month changes. Or configure the slicer to use relative date, such as This Month.
The problem with both approaches has been that if the calendar has just rolled forward but there is no data yet, end users will get wonderful insights from emptiness. Apparently, the support tickets from enterprise customers reached a critical mass and Microsoft acted. Therefore, in my opinion the important feature here is rolling forward but anchored to the last date in the Date column bound to the slicer.
For example, the last month with Adventure Works data is December 2014 so the Date dimension table has dates only until this date. Let’s say January 1st 2015 comes along but the semantic model doesn’t have data yet for January and therefore the Date table doesn’t have that date yet (or the slicer uses a DAX measure to filter dynamically the date range). The slicer will remain anchored to December 2014. Once we have data for January, the relative date configuration will switch to January.
TIP: If the Date table has future dates, you can use a DAX measure to filter the date range, such as SlicerDateFilter = IF(NOT ISBLANK([<SomeConditionToDetermineTheDateRange>]), 1, 0). Then drag your newly created SlicerDateFilter measure from the Data pane and drop it into the Filters On This Visual well in the Filter pane with the slicer selected.
https://prologika.com/wp-content/uploads/2016/01/logo.png00Prologika - Teo Lachevhttps://prologika.com/wp-content/uploads/2016/01/logo.pngPrologika - Teo Lachev2026-06-29 11:20:462026-07-06 19:01:11Power BI Date Picker
An excited enterprise client came back from a conference where Snowflake delighted them with AI demos and semantic views built on Open Semantic Interchange (OSI) standard. Snowflake even went further to show how their Cortex Analyst tool returns deterministic AI answers. Naturally, given their existing investments in Snowflake data lake and ODS, the client questioned why we don’t build everything in Snowflake instead of bringing Microsoft Fabric and two vendors into the mix.
What’s OSI?
Reading about the relatively freshly baked OSI, we learn that “the Open Semantic Interchange is an industry-wide specification effort to standardize how we exchange semantic metadata across analytics, AI and BI platforms, providing a vendor neutral, single source of truth for semantic data.” Great, I am all about standardization. If you ask me, the world should adopt the metric system and English as a universal language, and life will be much simpler. But this is about BI so let’s peek under the hood and keep ‘em honest.
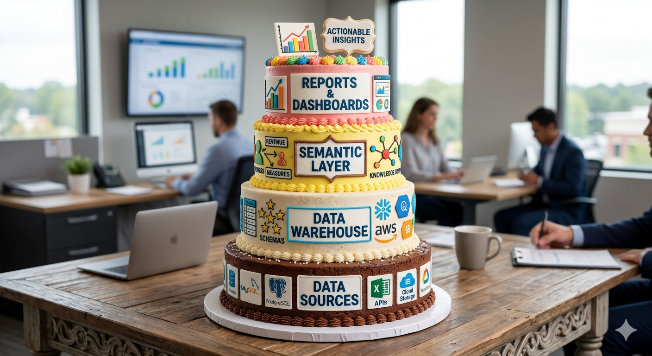
Now, like ogres and cakes, a BI architecture has layers. Besides data sources, at minimum I like to see a central repository (let’s called a data warehouse) with star schema (if the star is missing, you don’t have DW, but operational data source, sorry), semantic layer (don’t skip it!), and of course reports with possibly AI – the cherry on top of the cake. “Modern” medallionists will of course dream of a bigger cake with bronze, silver, and gold layers, and then wonder what to put in them, but I digress.
OSI is an initiative from major Microsoft competitors in the BI space (Snowflake, Dbt, Google, Databricks, Salesforce) to standardize the semantic model definition so good report vendors who have bad semantic models, like Tableau and Salesforce, can integrate with vendors who have good backends but bad reporting, like Snowflake and Google. Did I get this right? I believe the main goal here is to compete more effectively against Microsoft which currently dominates the data analytics space. All that wrapped with “avoid the vendor lock-in and single version of truth” story.
About Snowflake semantic views
A Snowflake semantic view is OSI-based metadata definition described in YAML inside their database. Created similarly to a SQL view, it enumerates the star schema dimension and fact tables, their relationships, and basic metrics with SQL formulas. Inside Snowflake, the semantic views are currently used by their Cortex Analyst tool (analogous to Copilot in Microsoft Fabric) to let users and apps talk to data with natural questions. Behind the scenes, the question is translated to SQL, which is how Microsoft Fabric Data Agent works when connected to a lakehouse or warehouse.
For the most part, tables, relationships, and metrics is all OSI has defined at this point. And of course, ontology to glue semantic views together so AI knows how to reason across them (or, to check the box when you hear that catchy phrase on the golf course since every CIO has heard about ontologies by now although no one knows what it means). I’m glad Snowflake calls them “views” and not semantic models, which would be a big misnomer. By contrast, Microsoft has a 30+ years head start on semantic modeling so the two technologies (semantic view vs semantic model) can’t be meaningfully compared by any criteria (features, tooling, etc.).
Shall we standardize?
At this point, Microsoft doesn’t participate in OSI. Although to the best of my knowledge Microsoft hasn’t released official reasons, more than likely it’s because they don’t need to. There is a large distance between Microsoft and the rest of the pack. Further, they spent 20+ years on their engine and DAX tooling. I don’t think it’s even possible to retrofit many features into a new SQL-based basic standard. For example, the OSI metric language is SQL while DAX is Excel-like language because the thinking back then was to transition Excel users into self-service BI. I remember having discussions with the Analysis Services team about why not use SQL, but alas, Excel prevailed…I wonder if they’ve made a mistake there.
Now, if we are serious about open standards and interoperability, then I would argue that we should start with data formats. Wouldn’t be nice if Google and Snowflake rewrite their databases to use open formats, such as Delta or Iceberg, before getting to the semantic layer? That would immediately facilitate data integration and virtualization, such as by letting a Fabric user create shortcuts in a lakehouse to Google and Snowflake tables instead of replicating the data, as I mentioned in my “Give me your data” blog. So, if we are serious about make integration easier, let’s start from the bottom up as Microsoft and Databricks did, shall we?
Meanwhile, if you have invested in another database vendor, my advice would be to use the best of both worlds. If you like Snowflake, use their database for lake/warehouse and Power BI/Fabric for its semantic models and reporting capabilities. The best data source for AI is a rich semantic layer (sorry, Snowflake OSI semantic views).
And about the Cortex AI deterministic answers, it’s pure marketing propaganda; all LLMs might vary their answers and are not guaranteed to return the same results.
If Microsoft Fabric was the Statue of Liberty, the inscription would be “Give me your data”. Fabric is obsessed with owning the data when it makes sense and when it doesn’t. As I wrote before, this pattern was probably borrowed from Palantir and to align Fabric with the push for “modern” medallion architectures. Or, to establish a permanent dependency on Fabric…
Auto-replicating data to Fabric
To satisfy the Fabric data appetite and facilitate data ingestion into OneLake, Fabric offers two primary options that don’t require explicit ETL: mirroring and shortcut transformations.
Mirroring targets a growing number of relational and non-relational database engines. Although described as “easy-to-use”, mirroring could prove challenging to set up in real life. For example, in one case, the client simply refused to set up mirroring from Google BigQuery because of the requirement to grant excessive permissions. In another case, we are still trying to figure out why mirroring doesn’t work from Azure SQL MI configured on private network. Not to mention that mirroring even from Microsoft SQL SKUs has limitations, such as historical temporal tables can’t be mirrored.
This leaves with the second option: shortcut transformations. They target a subset of file formats (not databases). Like mirroring, Fabric polls periodically the shortcut target folder and synchronizes the data in OneLake Delta tables. These transformations could be useful to provide convenient access to this data from Fabric workloads, such as to access reference data a business user maintains in an Excel spreadsheet in a Fabric Data Warehouse. On the downside, data must be exported and saved as files.
OneLake Shortcuts
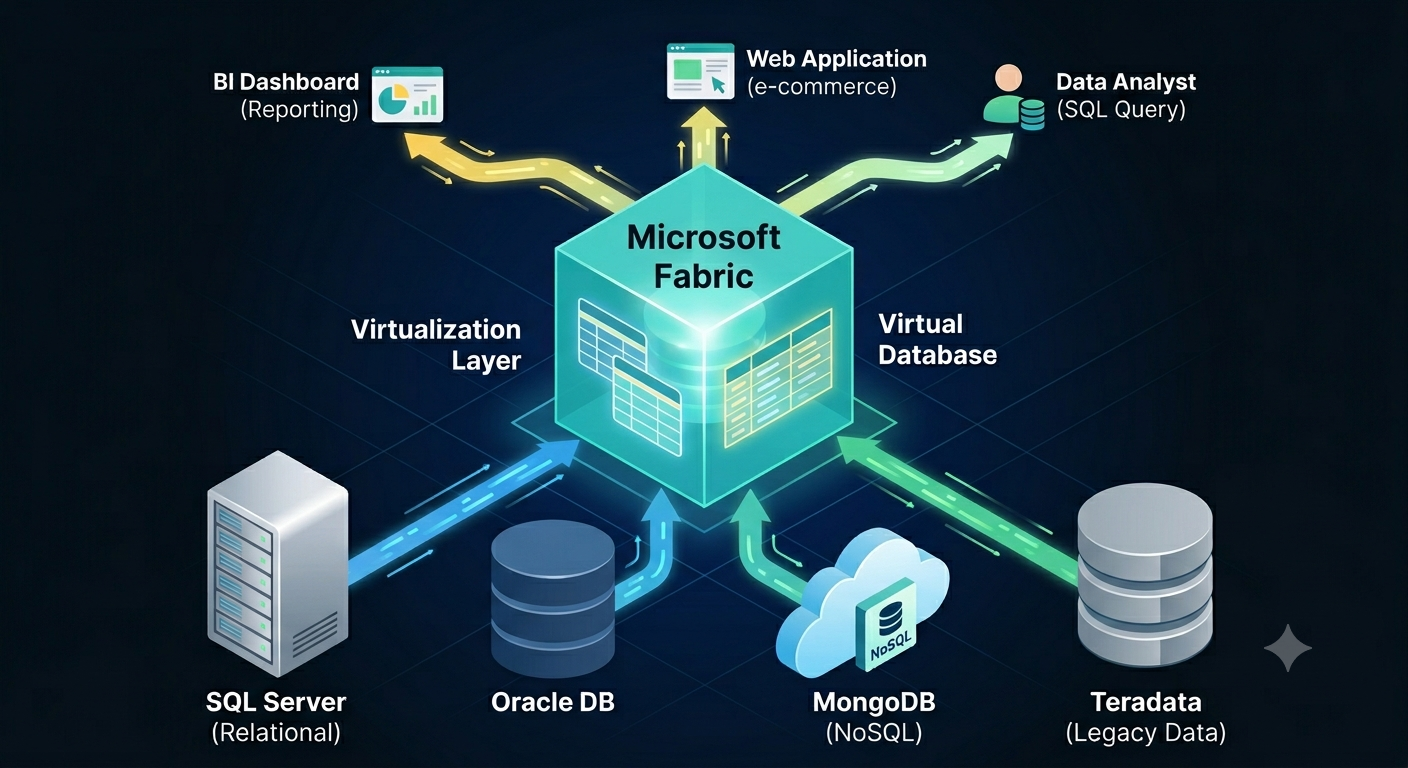
Yet, many scenarios could be addressed by simply accessing the data where it is. In other words, by data virtualization. As it stands, Fabric has limited file-based data virtualization capabilities with OneLake shortcuts. OneLake shortcuts shouldn’t be confused with the shortcut transformations mentioned before. OneLake shortcuts are read-only pointers to external files. These shortcuts are typically listed in the unmanaged section of OneLake (the Files folder). OneLake shortcuts don’t import the data in Delta tables. How are they useful then? The main thought is to conveniently share data between teams, workspaces, or domains, workloads, without moving it.
As an exception to the rule, if the OneLake shortcut points to a Delta table, such as OneLake or elsewhere, or Iceberg table, the shortcut still doesn’t copy the data but exposes it as OneLake Delta table. This lets you utilize Delta-specific features, such as a DirectLake semantic model without moving the data. I find this inspiring to imagine a simplified data integration in a world where one day other vendors could embrace standard file formats.
What about databases?
Based on experience, a typical company has 90+ percent of its data in relational databases or connectable non-file sources, such as REST APIs and SFTP servers. In my opinion, mirroring these (sometimes huge) datasets into a file-based, pseudo-relational lakehouse rarely makes sense. Wouldn’t be nice to have shortcuts to tables in these sources and then shape and get the data you need instead of writing ETL? And even better, run cross-database queries? Wouldn’t this be a great Fabric differentiator compared to other vendors?
Since time immemorial, SQL Server has been supporting linked servers and heterogenous joins across databases. Then PolyBase was supposed to replace linked servers and be the Microsoft answer to broader data virtualization. Alas, both technologies didn’t make it to Fabric. Linked servers are available only in on-prem SQL Server and with limited support in Azure SQL MI. Polybase was relegated to the on-prem SQL Server.
I think it’s time Fabric to fulfil its zero-copy promise and say “Let me connect the dots, don’t move that data”.
https://prologika.com/wp-content/uploads/2016/01/logo.png00Prologika - Teo Lachevhttps://prologika.com/wp-content/uploads/2016/01/logo.pngPrologika - Teo Lachev2026-06-04 15:08:362026-06-04 15:12:37Give Me Your Data!
Atlanta BI fans, please join us in person for our next meeting on Monday, June 1st at 18:30 ET. Elayne Jones (Senior Solution Engineer at Microsoft) will show you how to build enterprise-ready agents with Copilot Studio. These agents can source data from a variety of data sources including Fabric Data Agents. I will sponsor the meeting. For more details and sign up, visit our group page.
Delivery: In-person Level: Intermediate Food: Pizza and drinks will be provided
Agenda:
18:15-18:30 Registration and networking
18:30-19:00 Organizer and sponsor time (news, Power BI latest, sponsor marketing)
19:00-20:15 Main presentation
20:15-20:30 Q&A
Overview: A practical, hands‑on session for anyone ready to move beyond generic AI chat and start building purpose‑built, enterprise‑ready agents. You’ll learn what agents really are, how they differ from traditional chatbots, and where Copilot Studio fits alongside Microsoft 365 Copilot and Azure AI services.
Speaker: Elayne Jones is a Senior Solution Engineer at Microsoft. Elayne specializes in Microsoft Power Platform, delivering scalable solutions through Copilot Studio, Power Apps, Power Automate. She helps organizations modernize workflows, build low‑code applications, and unlock insights through integrated, data‑driven experiences.
Sponsor: Prologika (https://prologika.com) helps organizations of all sizes to make sense of data by delivering tailored BI solutions that drive actionable insights and maximize ROI. Your BI project will be your best investment, we guarantee it!
https://prologika.com/wp-content/uploads/2016/01/logo.png00Prologika - Teo Lachevhttps://prologika.com/wp-content/uploads/2016/01/logo.pngPrologika - Teo Lachev2026-05-26 16:44:462026-05-26 16:44:46Atlanta Microsoft BI Group Meeting on June 1st (Build Your First Agent in Copilot Studio)
In a previous post, I referred to an engagement where we used the Fabric Copy Job activity to replicate Google BigQuery tables to Fabric, so we can use Direct Lake semantic models. A few months later, the client reported that they pivoted from the Copy Job to notebooks using the Spark BigQuery connector for two main benefits:
Much better copy performance – Although the Copy Job would copy tables in parallel, the Spark BigQuery connector reduced significantly the data transfer time. The Copy Job would fully copy all tables in about 40 min. With the Notebook, while the tables run sequentially instead of in parallel, most tables would take between 20-30 sec and one huge 140M fact table takes around 2 minutes to copy fully. Altogether, the required tables take about 20-22 minutes to load, which is almost half the time less than the Copy Job. Upon further research to understand the difference in performance, I’ve discovered that the Spark BigQuery connector (the official one from Google) uses the high-performance BigQuery Storage Read API. This is a highly optimized, columnar, parallel reader designed for analytical workloads. It can push down filters, projections (column selection), and sometimes aggregations directly to BigQuery. It streams data very efficiently to Spark executors. By contrast, the Copy Job is generic, and I don’t expect such performance gain with other sources, such as copying data from Azure SQL DB.
Custom code flexibility – For example, the client implemented data-driven metadata discovery to determine which columns to copy per table. In addition, they could trigger the notebook execution via REST API.
In summary, there are various options to replicate data from Google BigQuery to Fabric, including mirroring, Copy Job, and notebooks. Each approach has its pros and cons. Notebooks using the Spark BigQuery connector would probably give you the best throughput for batch-oriented, massive replication.
Atlanta BI fans, please join us in person for our next meeting on Monday, May 4th at 18:30 ET. Jackie Kiadii will show you how you use the Copilot capabilities in Power BI. CloudStaff will sponsor the meeting. For more details and sign up, visit our group page.
Delivery: In-person Level: Beginner/Intermediate Food: Pizza and drinks will be provided
Agenda:
18:15-18:30 Registration and networking
18:30-19:00 Organizer and sponsor time (news, Power BI latest, sponsor marketing)
19:00-20:15 Main presentation
20:15-20:30 Q&A
Overview: Copilot in Power BI is generating excitement — and significant confusion. Between multiple Copilot experiences, Fabric capacity requirements, and differences across Desktop, Service, and Fabric, many Power BI professionals struggle to explain what Copilot actually does and when it makes sense to use it.
This session provides a clear, practical overview of:
Copilot use cases that exist today
Where Copilot works (and where it doesn’t)
Licensing and capacity requirements
Current limits that impact real‑world adoption
Rather than a technical deep dive or demo, the focus is on clarity and expectation‑setting — helping attendees evaluate Copilot realistically and explain it confidently to Excel users, business stakeholders, and clients.
Attendees will leave with a framework they can use to make informed decisions about Copilot and confidently explain it to others.
Speaker: Jackie Kiadii is a Power BI trainer specializing in helping Excel users successfully transition to Power BI and adopt Microsoft analytics tools with confidence. She is a retired Microsoft Excel MVP, Microsoft Certified Trainer (MCT), Microsoft Data Analyst Associate (PL‑300), and Microsoft Office Specialist: Excel Expert. Jackie focuses on turning complex Microsoft BI topics into clear, practical guidance that supports real‑world adoption. Her work emphasizes licensing clarity, user expectations, and helping teams avoid costly or unnecessary decisions when implementing Power BI and Copilot.
https://prologika.com/wp-content/uploads/2016/01/logo.png00Prologika - Teo Lachevhttps://prologika.com/wp-content/uploads/2016/01/logo.pngPrologika - Teo Lachev2026-04-28 15:58:082026-04-28 15:58:08Atlanta Microsoft BI Group Meeting on May 4th (Making Sense of Copilot in Power BI)
Coming back from a long vacation, I’ve almost missed this interesting Power BI enhancement: Power BI unmaterialized calculated columns. Normally, I avoid the traditional DAX calculated columns for a variety of reasons, such as confusion about where business logic is applied, limited support across storage modes (for example, Direct Lake doesn’t support them), longer refresh times, etc. This not to say that calculated columns can’t be useful, such as in the case where you need to flatten a parent-child hierarchy. But unmaterialized calculated columns could open interesting scenarios that go beyond content translation to other languages mentioned by Microsoft in the April 2026 update.
Understanding unmaterialized columns
To start with, the announcement does a good job to confuse the audience by implying that they are applicable only to Direct Lake storage mode. I’ve found the documentation page more useful to understand them (specifically this table). The important takeaway is that they are also available in import storage mode.
Historically, DAX calculated columns are materialized during data refresh, meaning that once the engine calculates the formula, the output is saved (materialized). From this point on, a calculated column behaves like a regular column. However, the calculated column expression can’t reference runtime report conditions, such as the identity of the interactive user or filter selection. By contrast, like a DAX measure, the expression of the unmaterialized calculated column is evaluated at runtime. Why would you ever want to do this if we have DAX measures? Let’s consider an example.
Using unmaterialized columns
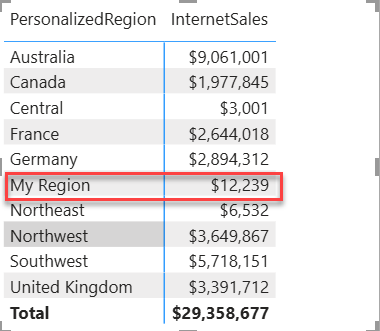
The Adventure Works DW schema has a DimSalesTerritory dimension. Suppose that the sales rep responsible for a given sales region would like to see his region as “My Region” on reports. This is probably a somewhat contrived scenario but I’m sure once you understand it, you will find other scenarios that can benefit from unmaterialized columns.
Implementing this without unmaterialized columns presents a challenge. You can come up with a DAX measure, but you will run into report limitations, such as that the measure can’t be used as a dimension to slice measures by. Or, you can go down the path of extending the model with other tables, but you will increase the complexity and user confusion. Unmaterialized columns open a new possibility by dynamically evaluating the expression, such as implementing runtime lookups. In my case, the expression of the PersonalizedRegion column is simple, but it can look up at runtime the assigned region from another table in the model, such as DimUser.
PersonalizedRegion = if (USERPRINCIPALNAME() = "<my email>" && SalesTerritory[SalesTerritoryRegion] = "Southeast", "My Region", SalesTerritory[SalesTerritoryRegion])
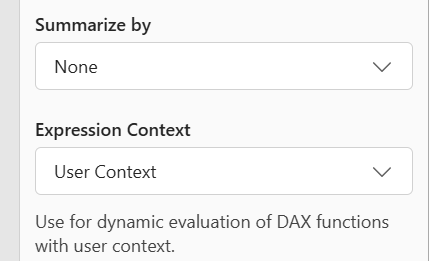
As you can see, the column expression can reference any DAX function, just like a measure. For this to work, you must flag the column expression context to User Context in the advanced column properties in Model View. Consequently, the column data is no longer materialized.
But the most important point is that you can continue using the column as a dimension, such as by adding it to the Rows or Columns wells in a Matrix visual. You can’t do this with a measure and that makes all the difference.
Summary
In summary, unmaterialized calculated columns bridge two previously completely distinct DAX worlds: calculated columns and measures. Like measures, they can reference runtime report conditions, such as the interactive user identity and report filters. Like columns, they can be used as dimensions. On the downside, like measures, complex formulas might impede the report performance.
I’ve mentioned previously in the “A Couple of Direct Lake Gotchas” post that unlike Power BI reports, Excel surprised me by not showing user-defined hierarchies in a Direct Lake model. Direct Lake comes with other gotchas, such as not supporting DAX calculated columns and SQL views. I normally don’t use calculated columns, but they can come in handy, such as for flatting a parent-child hierarchies outside ETL. And I like SQL views as an insurance policy for making quick transforms or filters on top of loaded tables to avoid ETL changes.
Recently, Microsoft introduced composite Direct Lake models which I demonstrated as a part of a pilot project, mainly to preserve the Excel report experience for financial users.
Direct Lake Only vs Composite Direct Lake
I view the composite Direct Lake models as the best of both worlds and this table summarizes their characteristics.
Direct Lake Only
Composite (Direct Lake + Import) Public Preview
Storage mode
Direct Lake
Some tables, such as dimensions, in import mode, others, such as fact tables, in Direct Lake
Imported tables must be refreshed, such as overnight for dimension changes
Memory consumption
Used columns in reports are paged in and out
Refresh requires at least twice the memory of imported objects
SQL Views
No
Yes
Calculated columns
No
Yes, such as PATH and PATHITEM to flatten parent-child hierarchies outside ETL
User-defined hierarchies
Power BI reports
Power BI, Excel, and Anaplan
Power Query
No
Yes
Therefore, composite Direct Lake models could be a good compromise between real-time BI and flexibility. For example, now you can implement the following configuration:
1. Dimensions in Import mode and refresh them overnight since they probably don’t change frequently anyway.
2. Large fact tables or tables requiring real-time BI in Direct Lake without refresh.
Lessons Learned
If composite models sound appealing, you might be eager to convert an existing Direct Lake model to composite. Here are some issues/gotchas that I ran into doing so:
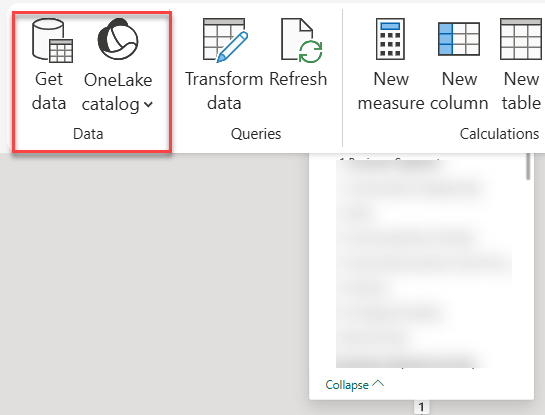
The web modeling experience (currently, the only way to add imported tables using Microsoft tooling) would show the Get Data buttons disabled. After some reverse-engineering of a brand new model, I fixed it my changing the connection expression in the *.bim file to use onelake (previously, it was pointing to a Fabric warehouse).
In my case, since there weren’t that many tables, I converted the dimension table partitions manually to “M” partitions, as in this example (change bolded text for each table):
After switching a partition from Direct Lake to Import in PBI Desktop project and synchronizing to the connected published model, Fabric rejected the change complaining that existing DirectLake table can’t be switched to imported storage. As a workaround, I dropped the connected model.
Being in public review, Composite Direct Lake is rough around the edges. I’ve got various complaints about credentials missing which I fixed in the dataset settings.
Although the documentation says that web modeling is the only tooling experience, Power BI Desktop worked for me as with the Direct Lake only counterpart. However, currently Power Query and Get Data (unless you add the tables directly in *.bim file) is only available on the web.
A “Limited” Performance Note
I know everyone is interested in performance. I did some limited performance tests by tracing a massive query against equivalent Direct Lake Only and Composite Direct Lake models. On a cold cache, Composite outperformed Direct Lake Only by some 20%. On a warm cache, surprisingly I saw the reverse, Direct Lake Only outperforming Composite five to six times. Please don’t take this verbatim. More than likely, your results will vary. For example, in that blog I said that I saw much better performance with SWITCH…CASE in Imported vs Direct Lake. Test!
Atlanta BI fans, please join us in person for our next meeting on Monday, March 2nd at 18:30 ET. Shabnam Watson will show you how you can apply your SQL skills in Microsoft Fabric. And your humble correspondent will walk you through some of the latest Power BI and Fabric enhancements. I will sponsor the meeting. For more details and sign up, visit our group page.
Delivery: In-person Level: Beginner/Intermediate Food: Pizza and drinks will be provided
Agenda:
18:15-18:30 Registration and networking
18:30-19:00 Organizer and sponsor time (news, Power BI latest, sponsor marketing)
19:00-20:15 Main presentation
20:15-20:30 Q&A
Overview: New to Microsoft Fabric? Don’t worry—you already know more than you think. In this beginner-friendly session, we’ll explore how your existing SQL skills translate directly into Fabric without needing to learn Spark, Python, or unfamiliar engineering tools. You’ll see how SQL can be applied across Fabric items to explore, shape, and analyze data with confidence. If you’re just beginning your Fabric journey, this session offers a simple, approachable path to success using the skills you already have.
Speaker: Shabnam is a business intelligence consultant and owner of ABI Cube, a company that specializes in delivering data solutions using the Microsoft Data Platform. She has over 20 years of experience and is recognized as a Microsoft Data Platform MVP for her technical excellence and community involvement. She is passionate about helping organizations harness the power of data to drive insights and innovation. She has a deep expertise in Microsoft Analysis Services, Power BI, Azure Synapse Analytics, and Microsoft Fabric. She is also a speaker, blogger, and organizer for SQL Saturday Atlanta – BI version, where she shares her knowledge and best practices with the data community.
Sponsor: Prologika (https://prologika.com) helps organizations of all sizes to make sense of data by delivering tailored BI solutions that drive actionable insights and maximize ROI. Your BI project will be your best investment, we guarantee it!
https://prologika.com/wp-content/uploads/2016/01/logo.png00Prologika - Teo Lachevhttps://prologika.com/wp-content/uploads/2016/01/logo.pngPrologika - Teo Lachev2026-02-25 13:29:302026-02-25 13:29:30Atlanta Microsoft BI Group Meeting on March 2nd (Your First Steps in Microsoft Fabric Using Just SQL)