Atlanta MS BI fans, join me for the next Atlanta MS BI Group meeting on Mar 28th and 6:30 PM. Luis Figueroa will show us how to do cloud ETL with Azure Data Factory. Allegient will sponsor the event. Don’t forget to register at atlantabi.sqlpass.org.
Azure Data Factory is a modern data orchestration platform design to help you manage any data of any size from any source. It also makes a number of technologies available to you such as Azure Machine learning so that you can integrate predictive machine learning models in your data pipelines. This platform enables you to create intelligent applications that not only provide insights but can also recommend actions upon specific events. Join me in this session as we take a closer look at many of the capabilities built into the platform.
Speaker:
Luis Figueroa serves as the Practice Lead for the Data Platform and Analytics division at Allegient, LLC. Luis is focused on delivering business solutions that leverage the Microsoft ecosystem of products. His areas of expertise are Data Warehousing, Business Intelligence, Big Data and Advanced Analytics. With 10+ years of experience in the field, Luis has delivered data management solutions for companies across many industry verticals. Luis is also a Microsoft P-TSP and chapter leader of the PASS Data Science Virtual Chapter.
Sponsor:
Allegient is a leading IT consulting firm that specializes in translating business objectives into technology solutions. We leverage proven technologies and methodologies that best align with your organization’s needs, resources and timeline. Focus areas include Business Process Management, Business Intelligence, Collaboration, Relationship Management (CRM/xRM), Custom Application Development & Sustainment, and IT Service/Project Management.
https://prologika.com/wp-content/uploads/2016/01/logo.png00Prologika - Teo Lachevhttps://prologika.com/wp-content/uploads/2016/01/logo.pngPrologika - Teo Lachev2016-03-24 08:55:392016-03-24 08:55:39Atlanta MS BI Group Meeting on Mar 28th
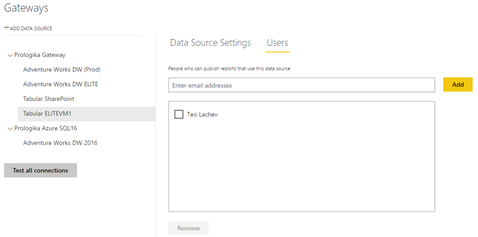
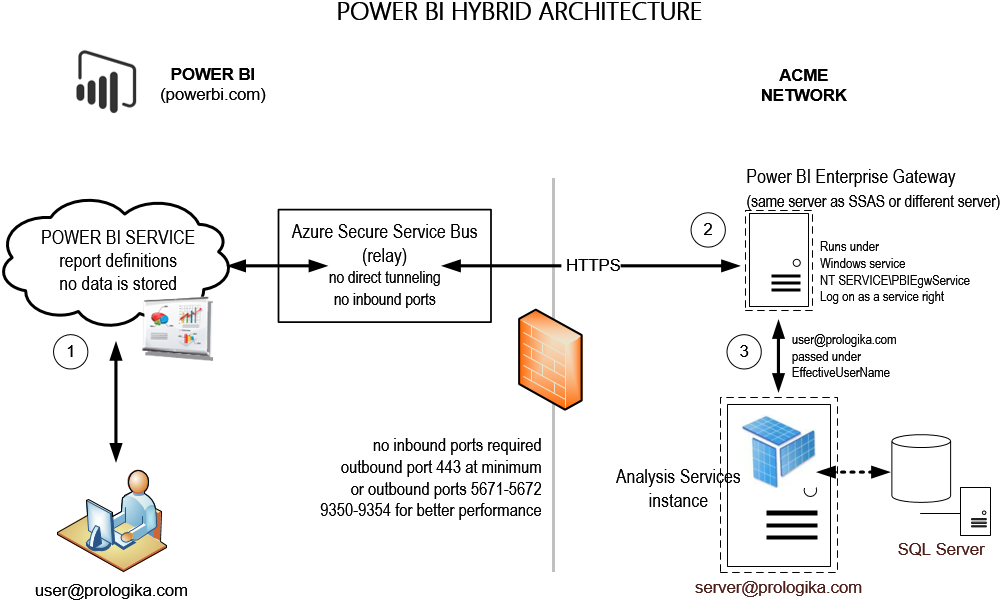
A unique and tremendously useful Power BI feature allows you to implement hybrid solutions where your data remains on premises (SSAS, SQL Server, Oracle, and other data structures) but only report and dashboard definitions are deployed to powerbi.com. This hybrid architecture gives you the best of both worlds: cutting edge cloud-based visualizations with on-premises security, scale, and single version of truth. Since no cloud application can connect directly to your network, a connectivity software, called Power BI Enterprise Management Gateway, acts as a bridge between powerbi.com and your data sources.
I’m wrapping up a Power BI Hybrid Architecture proof of concept (POC) for a large organization and I want to recap some important lessons learned:
I’m really astonished by the roundtrip speed! It’s remarkable that the round trip completes so fast given that powerbi.com (a data center in Virginia for East Cost I believe) connects to a data center in Atlanta. Granted, not much goes across the wire. Power BI sends a DAX query and SSAS sends summarized results. Still, latency is not an issue. As another customer puts it, “the Power BI reports have better performance than our on-premises SharePoint reports”.
Power BI Enterprise Gateway uses the Azure Secure Service Bus relay connection. What this means for you is that you don’t have to open any incoming ports on your company’s firewall. When the gateway establishes an outbound connection, it scans the available outbound ports. If the only port open is 443 (HTTPS), then it uses this port. Because port 443 might be heavily used, you can open outbound ports 5671-5672 and 9350-9354 for better performance. However, I didn’t see any performance degradation with port 443. This is another remarkable performance observation given that this organization has thousands of computers that use this port when connecting to Internet.
The only setup snag I encountered was this organization uses a proxy that is configured for Basic Authentication only and gateway failed to connect on a first try. I had to create a .NET assembly that returns the credentials of an account with permissions to the proxy using the module configuration element. If your organization doesn’t use a proxy or it does, but the proxy supports NTLM security, you won’t have this issue.
The gateway can be installed on the same machine as the data source or another machine. I recommend installing it on a different machine for an additional level of security. Since one gateway can access multiple data sources, a dedicated gateway server makes more sense. Currently, the gateway service is not fault tolerant but you can install another gateway instance on another machine that services the data sources that need to be highly available.
By default, the gateway runs under a NT SERVICE\PBUEgwService account that the gateway setup creates. You can use another Windows account of course. It needs to have a “Log on as service” right and it needs to be a member of the Performance Log Users local group. The gateway should have no issue running as another low-privileged account, such as LocalService.
Besides the setup requirements and limitations when connecting to SSAS, creating a data source requires hardcoding the credentials of a Windows account that has admin rights to SSAS to delegate the user identity via EffectiveUserName so that SSAS data security works. This might present an issue if your organization has a password expiration policy for service accounts (typically this is not the case bus this organization has to comply to regulations and customer service contracts). I suggested to Microsoft to support another option that would allow connecting to SSAS using the gateway service account via NTLM security. This would allow you to use a managed service account for the gateway service whose password expiration is managed by the domain controller.
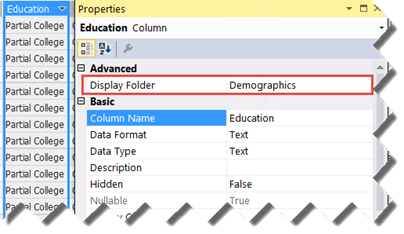
A welcome usability enhancement in SQL Server 2016 Tabular is the ability to configure display folders to organize table fields and measures in logical folders. Previously, you had to use BIDS Helper or DAX Editor (for measures) to implement display folders. Starting with SQL Server 2016, you can just set the Display Folder property of a measure or a field.
This adds the display folder to Fields List in Excel and Power BI Desktop.
On a personal note, I’m excited to announce the launch of the new Prologika website (https://prologika.com), which adds a slew of new features to connect better with customers and readers, including site-wide search, responsive web design, case studies, book and blog discussion lists, and more to come. Although the old blog feed should still work, please update it to https://www.prologika.com/feed/. Continuing on the list of announcements, Microsoft added a Prologika Power BI case study to the Power BI partner showcase. Speaking of Power BI, I definitely see a lot of interest from customers in Power BI-based solutions, ranging from self-service BI to white-labeling and report embedding. Last but not list, our Atlanta MS BI group is an official Power BI group! So, if you’re interested in Power BI, check our monthly meetings which now feature more Power BI content.
Spring is here and it brings again a new version of SQL Server. Microsoft launched SQL Server 2016 on March 10th. Its product page include nice videos covering some of the new features. The great news is that the “box” has seen a renewed interest and Microsoft has made significant investments in all the bundled services to help you implement cost-effective and modern data analytics solutions on premises. In this newsletter, I’ll enumerate my favorite BI new features in SQL Server 2016. Feel free to also check my slides on this topic on my LinkedIn profile page.
Tools
The days of waiting years for the next SQL Server release are coming to an end, as you first witness with the client tools.
SSMS – You no longer have to run the SQL Server setup just to get SQL Server Management Studio (SSMS). SSMS is now available as a free and standalone download here. Moreover, it will be updated on a monthly basis and it will be backward compatible for all SQL Server supported versions!
SSDT – Also, to everybody’s delight, the BI add-on to SQL Server Data Tools (SSDT) is gone. Instead, you just download and install SQL Server Data Tools, which includes the BI projects. No more installing three setup packages to get to the BI stuff. To make your joy complete, SSDT is backward compatible. Actually, SSRS and SSAS have been backward compatible for a while, but now SSIS joins the list so that you can use SSDT to work with legacy SSIS packages.
Database Engine
There are many new features in the Database Engine but the following will be of particular interest to BI practitioners:
Updatable columnstore indexes – They will allow you to speed up aggregated queries without having to drop and recreate the columnstore index.
Live query statistics – How many times you had to troubleshoot the performance of massive query with many joins? Live query statistics will now show you which joins slows the query down.
Temporal tables – Anyone who’s implemented ODS knows that maintaining Type 2 changes is no fun. Temporal tables can maintain changes on any column for you. This feature is also great if you need data change auditing.
Integration with R – Leveraging the Revolution Analytics acquisition, the R Server allows your data analysts to run R scripts on top of the SQL Server data. Moreover, DBAs can configure resource limits so that these scripts don’t impact the database performance.
SQL Server Integration Services (SSIS) and Master Data Services (MDS)
I’m somewhat disappointed that the Power Query integration and Lineage Statistics didn’t make the cut. Anyway, here are my favorites:
Incremental project deployment – you can just deploy changed packages to the catalog instead of deploying the entire project.
Package parts – you can refactor some control flow tasks in reusable package parts that you can manage separately. This could be very beneficial for SSIS “frameworks” so that you don’t have to update all packages if some changes are introduced later in the development cycle.
Cloud tasks and connectors – Lots of attention to moving and transforming data in Azure. For example, there is a task that will allow you to move data to Azure Blog storage in the most efficient way. Continuing this line of thought, the fastest way to move the data to Azure SQL DW would be to use Polybase which supports HDInsight and Azure Blob Storage.
MDS Entity Sync – Allows you to reuse entities among models. For example, you can implement a Common model with entities, such as Geography, that you can configure for auto synchronization with other models.
15x performance increase in MDS Excel add-in.
SQL Server Reporting Services (SSRS)
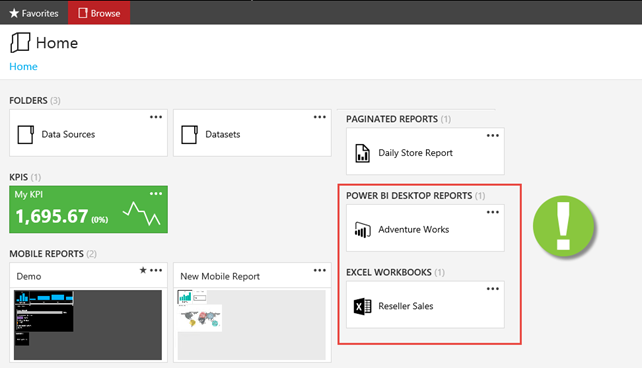
As per the Microsoft’s updated reporting roadmap, SSRS comes out of the closet to fulfill its new role of becoming the on-premises platform for paginated (pixel-perfect), mobile, and Power BI Desktop reports (support for Power BI Desktop files in SSRS will happen after SQL Server 2016). SSRS saw a lot of attention in SQL Server 2016 and brings major new enhancements:
Better mobile support – SSRS reports now render in HTML5. Users can use the Power BI native apps for iOS, Android and Windows devices to render both SSRS and Power BI reports. ActiveX print control has been replaced with PDF printing that works on all modern browsers.
Facelift – SSRS 2016 brings a new report portal (aka Report Manager). Report Builder has a new look too. Charts and gauges have a new modern look. New chart types (Sunburst and Treemap) have been added. You can now add KPIs directly in the Report Portal.
Mobile reports – Thanks to the Datazen acquisitions, you can now have in the box reports that specifically target mobile devices, that have similar features as competing vendors, such as PushBI (now part of Tibco) and RoamBI.
Parameter area – You can now control the parameter placement. Personally, I expected also more control over parameters, such as parameter validation, but the alas, the wait is not over.
Prioritized native report mode – Microsoft now prioritizes SSRS in native mode which is a great news for customers who previously had to adopt SharePoint Enterprise just for BI. In fact, all the new features are available only in SSRS native mode.
SQL Server Analysis Services (SSAS)
As you know by now, I’m a big fan of classic BI solutions that feature a semantic layer (Multidimensional or Tabular). SSAS gets many new features, including:
Tabular many-to-many relationships – You can now implement M2M relationships by setting the relationship cross filtering direction to Both, as you can in Power BI Desktop.
Tabular Direct Query enhancements – Microsoft put a lot of effort to lift previous Direct Query limitations in Tabular so that you can build Tabular models on top of fast databases without having to cache the data. Direct Query now have better performance, support for row level security, support for MDX clients such as Excel, support for Oracle, Teradata, and Azure DW.
New Tabular scripting language – Tabular models are now described in a new lightweight JSON grammar. This speeds up scheme changes, such as renaming columns. In addition, a new Tabular Object Model (TOM) is introduced to help developers auto-generate Tabular models.
DAX new functions – Many new DAX functions (super DAX) were introduced.
Multidimensional – support for Power BI and Power BI Desktop. Support for Netezza as a data source. Distinct count ROLAP optimization for DB2, Oracle, and Netezza. Drillthrough is now supported with multi-selection, such as then the user filters on multiple values in Excel.
SQL Saturday Atlanta #521: A free training event for all things SQL Server on May 21st.
As you’d probably agree, the BI landscape is fast-moving and it might be overwhelming. If you need any help with planning and implementing your next-generation BI solution, don’t hesitate to contact me. As a Microsoft Gold Partner and premier BI firm, you can trust us to help you plan and implement your data analytics projects, and rest assured that you’ll get the best service.
Regards,
Teo Lachev
Prologika, LLC | Making Sense of Data
Microsoft Partner | Gold Data Analytics
Due to popular demand, we’ve added two more classes to our training curriculum.
Applied SQL Fundamentals – This 2-day instructor led course provides you with the necessary skills to query Microsoft SQL Server databases with Transact-SQL. This course starts with the basics of a SELECT statement and its syntax, and progresses to teach you how to join, aggregate, and convert data. This course is perfect for developers who need to query SQL Server databases to retrieve data, from complete beginners through to more experienced developers who can use some of the modules as reference material. It will benefit novice Database Administrators, Database Developers, and Business Intelligence professionals. It will also benefit SQL power users who need to create SQL queries, including report writers, data analysts, and client application developers.
Applied Microsoft BI – This 4-day class is designed to help you become proficient with the Microsoft BI toolset and acquire the necessary skills to implement an organizational BI solution. You’ll learn how to design a star schema, use SQL Server Integration Services to transform data, and implement a Tabular semantic model. Depending on the students’ skillset, it can be customized, such as to reduce coverage of specific technologies, replace them with other topics of interest, such as Multidimensional instead of Tabular, or cover additional topics, such as Power BI or Reporting Services.
https://prologika.com/wp-content/uploads/2016/01/logo.png00Prologika - Teo Lachevhttps://prologika.com/wp-content/uploads/2016/01/logo.pngPrologika - Teo Lachev2016-02-29 14:05:302016-03-09 00:49:45Two New Prologika Training Courses
Atlanta MS BI fans, join me for the next Atlanta MS BI Group meeting on Feb 29th and 6:30 PM. I’ll present “What’s New in SSRS 2016”. Don’t forget to register at atlantabi.sqlpass.org. Nevron will be our sponsor. Vishal Pawar will do us a quick Prototypes with Pizza demo about the new features in the Power BI Feb update.
Reporting Services plays an important role in the updated Microsoft on-premises BI roadmap as a platform for delivering paginated, mobile, and interactive reports. This is a great news for many customers who previously had to rely on SharePoint for BI. Microsoft has made significant investments in SQL Server 2016 to bring Reporting Services up to its new role. Join this session to learn about these exciting new enhancements, including HTML5 rendering, mobile reports, new report portal, Power BI integration, and many more.
Speaker:
Teo Lachev founded Prologika, now a Microsoft Gold BI Partner, in 2004 with a mission to help organizations make sense of data by effectively applying BI technologies. Teo has authored and co-authored several SQL Server BI books. He founded and has been leading the Microsoft Business Intelligence Group in Atlanta since 2010. Microsoft has recognized Teo’s experience in Business Intelligence and contributions to the technical community by awarding him the Microsoft Most Valuable Professional (MVP) status since 2004.
Sponsor:
Founded in 1998, Nevron Software is specialized in the development of premium presentation layer and data visualization components for .NET based technologies.For over a decade, Nevron has been recognized as a leading vendor of advanced Charting, Diagramming and Data Visualization solutions for Microsoft Technologies.Nowadays, Nevron is also the driver of one of the biggest innovations in the .NET world – Nevron Open Vision (NOV). NOV changes the .NET ecosystems of Microsoft and Xamarin by providing them with a single presentation layer API.
https://prologika.com/wp-content/uploads/2016/01/logo.png00Prologika - Teo Lachevhttps://prologika.com/wp-content/uploads/2016/01/logo.pngPrologika - Teo Lachev2016-02-26 15:20:362016-03-08 00:51:15ATLANTA MS BI GROUP MEETING ON FEB 29TH
Scenario: Some of the controls in SSRS 2016 mobile reports (previously known as Datazen) require a date field. The Mobile Publisher would refuse binding the control to an SSAS shared dataset if a column of a Date data type is not present. That’s because when you create a dataset, you write an MDX query and MDX returns the field name as a string.
Solution: You can use add a calculated member to the query that returns the MEMBER_VALUE property. MEMBER_VALUE returns in the underlying data in its native data type. For this to work in Multidimensional, you need to set the Value property of the Date attribute of your Date dimension to an underlying column of a Date data type. The following example, shows a sample query that uses the Adventure Works Tabular model.
WITH MEMBER [Measures].[Total Sales] as ([Measures].[Internet Total Sales] + [Measures].[Reseller Total Sales])
MEMBER DateCasted as Iif([Measures].[Total Sales]=0, null, [Date].[Date].CurrentMember.MEMBER_VALUE)
SELECT
{
[Measures].[DateCasted],
[Measures].[Total Sales],
[Measures].[Internet Total Sales],
[Measures].[Reseller Total Sales]
}
ON 0,
NON EMPTY [Date].[Date].Children ON 1
FROM [Model]
Because the DateCasted column is now of a Date data type, Publisher now allows me to bind the dataset to a TimeNavigator control that requires a date column.
https://prologika.com/wp-content/uploads/2016/01/logo.png00Prologika - Teo Lachevhttps://prologika.com/wp-content/uploads/2016/01/logo.pngPrologika - Teo Lachev2016-02-25 01:47:002016-03-14 21:28:21Getting Mobile Reports to Recognize SSAS Dates
The title says it all! Note that the evaluation was done in July-August 2015. Some of the missing points Gartner points out in the report have been implemented already, such as custom visuals So by now the bubble should have moved up toward the ability to execute J
Beyond Power BI, I found the following Gartner’s strategic observations interesting:
By 2018, data discovery and data management evolution will drive most organizations to augment centralized analytic architectures with decentralized approaches.
By 2017, 75% of IT organizations will have a bimodal capability; half will not handle this well, by either remaining over-controlling or completely ignoring the risks of more agile approaches.
By 2017, highly featured and easy-to-use freemium and low-license-cost business intelligence (BI) offerings will accelerate user adoption deep into the enterprise beyond traditional BI users.
Want to learn Power BI? We’re still accepting students for the online class starting Monday.
https://prologika.com/wp-content/uploads/2016/01/logo.png00Prologika - Teo Lachevhttps://prologika.com/wp-content/uploads/2016/01/logo.pngPrologika - Teo Lachev2016-02-04 21:35:002021-02-16 02:32:33Gartner Positions Microsoft as a Leader in BI and Analytics Platforms
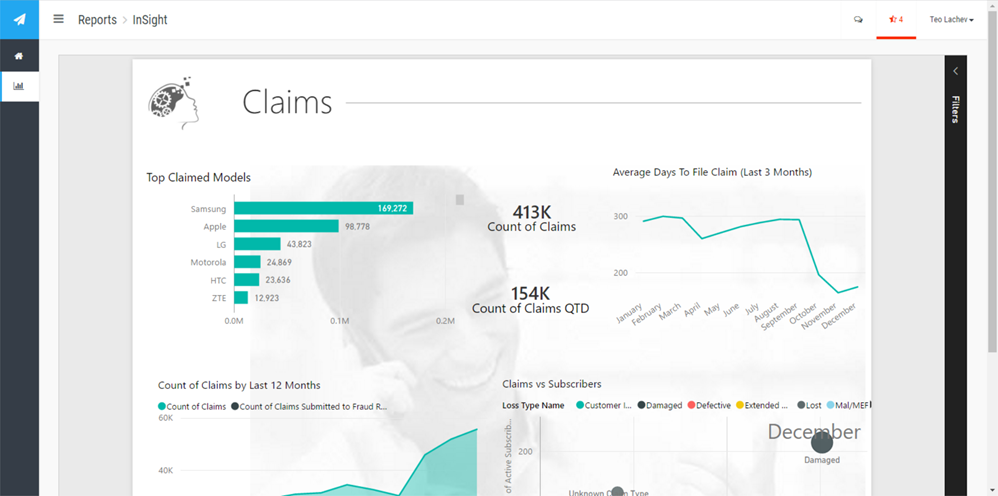
Microsoft launched a Power BI Partner Showcase section to help you “find the right solution for your organization” from certified partners like Prologika. I’m excited to announce the first Prologika Power BI Showcase! It’s based on the work we did for an insurance company. This solution transformed the organization’s data into a key strategic business asset, empowering employees like never before. It currently includes over 300 performance measures that can be analyzed across various dimensions, enabling business to collaborate and share insights with rich data storytelling. The solution delivers a “single version of truth” approach for reporting, and empowers business users to build customized reports and analyses using various tools.
“We are extremely excited for the actionable intelligence and foresight this new tool will bring to our organization”
Director Supply Chain Analytics
Visit the solution page to learn more about how we did it, watch a short video, and even try the interactive reports! Have questions? Contact me to today to find how Power BI can change your business!
https://prologika.com/wp-content/uploads/2016/01/logo.png00Prologika - Teo Lachevhttps://prologika.com/wp-content/uploads/2016/01/logo.pngPrologika - Teo Lachev2016-02-04 03:38:002016-02-20 10:42:48Prologika Power BI Showcase
Call/email us if you have any questions about the class. Registration closes on January 31st.
Join Teo Lachev as he presents his online Applied Power BI class. Power BI is a Microsoft cloud-hosted BI platform that opens BI to everyone without reliance on IT. And most of it is free! This class is designed for business users and data analysts. You’ll learn:
What is Power BI and why it’ll disrupt the way you analyze your business.
How to get instant insights from cloud services, such as Google Analytics, Dynamics CRM Online, Salesforce, and many others.
How to create sophisticated self-service data models whose features are on a par with models built by BI pros.
How to clean and shape dirty data.
How to create insightful interactive reports and dashboards.
How to share BI content with other users and view it on mobile devices.
No travel, no hotel expenses, just 100% content delivered right to your desktop! Our intensive online classes teach you the skills to master Microsoft BI to its fullest. Use the opportunity to ask questions and learn best practices.
Applied Power BI Training in February
NEW!Applied Power BI Online Training Class
Date: February 8 – February 9, 2016
Time: Noon – 4:00 pm EDT; 9 am – 1:00 pm PDT
Delivery: Online presentation with access to recorded content
https://prologika.com/wp-content/uploads/2016/01/logo.png00Prologika - Teo Lachevhttps://prologika.com/wp-content/uploads/2016/01/logo.pngPrologika - Teo Lachev2016-01-27 03:20:002016-02-20 14:31:28Improve your Power BI skills – Five days left to register!