-
Getting Rid Of Custom Visuals
January 10, 2016 / No Comments »
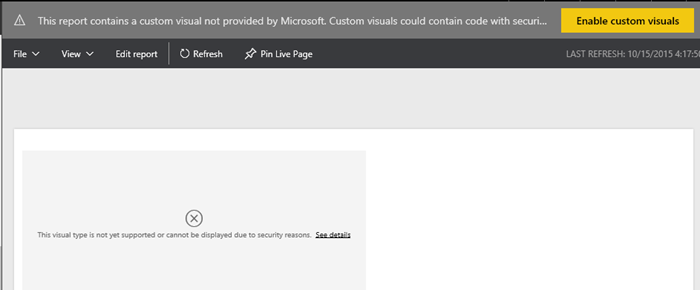
Scenario: You might have imported a custom visual in Power BI Desktop, tested it, and decided not to use it. However, even if your reports don't use the visual anymore, Power BI will still prompt you if you want to enable custom visual with "This report contains a custom visual not provided by Microsoft…". This is a security warning to avoid malicious code because custom visuals are deployed in Javascript. Currently, there is no way in Power BI to disable this prompt. To make things worse, neither Power BI Service nor Power BI Desktop have a feature to get rid of the custom visual once it's added to a Power BI Desktop file. Solution: Here are the manual steps are followed to get rid of custom visuals in Power BI Desktop file for good: Copy the Power BI Desktop (*.pbix) file. Rename the file to have a zip extension, e.g....
-
Implementing User Friendly Names in Tabular
January 7, 2016 / No Comments »
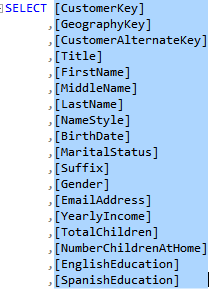
Scenario: You'd want to have user-friendly field names in Tabular, Power Pivot, and Power BI Desktop, such as Claim Amount as opposed to database column names, such as ClaimAmount or Claim_Amount. Multidimensional has a feature that automatically delimits words with spaces when it detects a title case or underscore but Tabular lacks this feature. While you can rename fields in Tabular on field at the time, each step requires a commit action, thus taking long time to rename all fields. Solution: While I'm not aware of a tool for renaming fields, the following approach should minimize the tedious work on your part: Wrap your table with a SQL view. It's a good practice anyway. Alias the table columns. If you have a lot of columns, the easiest way to alias your columns is to use vertical copy and paste. In SSMS, script the table as SELECT TO. This generates the...
-
Microsoft Acquires Metanautix
January 1, 2016 / No Comments »
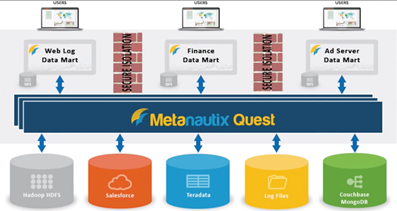
If you've missed the announcement from a couple of weeks ago, Microsoft acquired Metanautix – a startup founded by ex-Google engineers who worked on BigQuery (aka Dremel). Technical details are scarce at point. In fact, the Metanautix website doesn't exist anymore but there are YouTube videos and slides, such as this one. A while back, I wrote about logical data warehouses, which come in different shapes and names, such as software-defined data marts, distributed data, and, what I call, brute-force queries, such as Amazon QuickSight. It looks like that with this acquisition, Microsoft is hoping to make a step in this direction, especially when it comes to Big Data analysis. From I was able to gather online to connect the pieces, Metanautix Quest uses a SQL-like language to define tables that point to wherever the data resides, such as in HDFS, flat files, or RDBMS. The syntax to define a...
-
SSRS Treemap and Sunburst Charts
December 23, 2015 / No Comments »
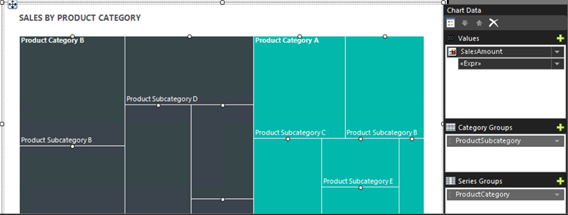
Years ago, I wrote a blog about how, with some code wizardry, you can create heat maps with Reporting Services. Moving to SSRS 2016, you don't have to do this anymore thanks to the new Treemap chart type! Speaking of new charts, SSRS also adds a Sunburst chart.
-
Integrate SSRS 2016 Reports with Power BI
December 18, 2015 / No Comments »
As I said in the "Microsoft Unveils BI Roadmap" blog, SSRS will play an important role of the on-premises BI portal. With this post, I'll start covering the new SSRS 2016 features. One of the Power BI features announced at the PASS Summit was the forthcoming integration between SSRS 2016 and Power BI that will allow users to pin SSRS report items to Power BI dashboards. You can test pining reports items to Power BI with SQL Server 2016 CTP 3.0 and later. The newly released CTP 3.2 also features the new sleek SSRS portal (we've come a long way!). The items you can pin currently include charts, gauge panels, maps, and images. Pinning a report item takes a few clicks: Open the report and click the Power BI button (a new toolbar button in SSRS 2016). If this is the first time you do this, you'll be asked to...
-
The One and Only Power BI Book
December 16, 2015 / No Comments »
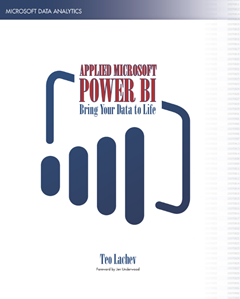
To me, Power BI is the most exciting milestone in the Microsoft BI journey since circa 2005, when Microsoft got serious about BI. Power BI changes the way you gain insights from data; it brings you a cloud-hosted, business intelligence and analytics platform that democratizes and opens BI to everyone. I'm happy to announce my latest (7th) book – Applied Microsoft Power BI. Currently, the one and only book on Power BI. Some people discouraged me to write this one. After all, trying to cover a product that changes every week is like trying to hit a moving target. However, I believe that the product's fundamentals won't change and once you grasp them, you can easily add on knowledge as Power BI evolves over time. Because I had to draw a line somewhere, "Applied Microsoft Power BI" covers all features that were announced at the PASS Summit 2015 and that...
-
Announcing Sparkline Visual
November 20, 2015 / No Comments »
A sparkline is a miniature graph, typically drawn without axes or coordinates. Commonly used on dashboards, sparklines typically visualize trends over time, such as to show profit over the past several years. Although other Microsoft reporting tools, such as Excel and Reporting Services include sparkline elements, Power BI doesn't have one. That is until now. I contributed a "classic" sparkline custom visual to the Power BI Visuals Gallery. Once you import and add the sparkline to a report, you bind the sparkline to data using the Data tab of the Visualization pane. For example, you can aggregate a Freight field added the Value area over the CalendarQuarterDesc field added to the Category area. The resulting graph will sho how freight fluctuates over time. You can use any field to group the data, not just a field from the Date table. The sparkline supports several formatting options. The General section lets...
-
New Tabular Schema in SQL Server 2016
November 13, 2015 / No Comments »
Those of you who had to generate programmatically Tabular models or make changes to the schema would agree that it was more complicated that it should have been. That's because Tabular borrowed the schema from Multidimensional so objects had to be defined in different places and in the SSAS MD terminology (dimensions, DSVs, etc). SQL Server 2016 CTP3 brings a new and much more simplified Json-based schema for describing SSAS Tabular models. To see it, you need to configure your workspace database in SQL Server 2016 (1200) compatibility mode. SSMS doesn't yet support the new schema but you can take a look at Model.bim once you create your project. When you open the source of the Model.bim file you'll see something completely different than the XML schema you were used to: { "name": "SemanticModel", "id": "SemanticModel", "compatibilityLevel": 1200, "readWriteMode": "readWrite", "model": { "culture": "en-US", "dataSources": [ { "name": "DW", "connectionString":...
-
Introducing Office Online Server
November 4, 2015 / No Comments »
Continuing the line of thought from my previous blog "Microsoft Unveils BI Roadmap", one nagging question still remains. What to do with all these Excel files now that SSRS came with a vengeance and has been promoted to THE on-premises BI platform? It looks like Microsoft is thinking along these lines. Interestingly, Excel Services will be removed from SharePoint Server 2016 and replaced with Office Online Server, as explained here. And this page gives more details about Office Online Server which is currently in preview. In a nutshell, Excel rendering would work pretty much in the same way as in SharePoint Server 2013. The most common scenario that Microsoft plans now is to have the Excel workbook in SharePoint. When you open the workbook, SharePoint will redirect you to the Office Online Server using a WOPI frame (some sort of an Iframe), with some special tokens that enable Office Online...
-
Microsoft Unveils BI Roadmap
October 29, 2015 / No Comments »
Today at the SQL PASS Summit 2015, Microsoft shared its BI roadmap for next year and beyond. The BI cloud roadmap shouldn't be a surprise to anyone. It's centered around Power BI. The main takeaway about the on-premises roadmap is deemphasizing the role of SharePoint and Office in favor of Reporting Services. In SQL Server 2016, SSRS will be extended to support Datazen reports. A future SQL Server update would support publishing Power BI Desktop files as well. "Just as we've added mobile report delivery to SSRS in SQL Server 2016, we intend to add governed Power BI Desktop report delivery in the future." Although this news will surely cause some commotion in a short term, I believe it's a good news for customers and BI practitioners in a long term. For customers, you no longer need SharePoint and SQL Server Enterprise licenses if all you need is sharing some...

We offer onsite and online Business Intelligence classes! Contact us about in-person training for groups of five or more students.