-
Granting Publishing Rights to Power BI Enterprise Gateway
April 8, 2016 / No Comments »
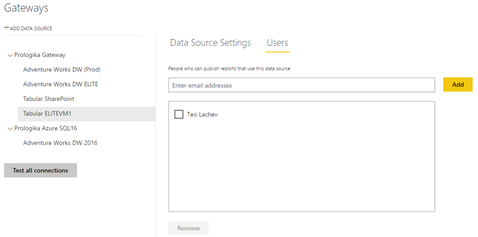
As I explained in a previous blog, the Power BI Enterprise Gateway allows Power BI reports to connect to on-premise data source. A gateway can support multiple data sources. When setting up a data source, you'll see the Users tab on the data source properties. The users you add here will have rights to publish reports that can connect to a data source serviced by the gateway. This is another security check that Microsoft implemented to limit the number of people who can expose data via the gateway. If a user is not in the Users tab, the user can publish a Power BI Desktop file to My Workspace (or to another Power BI workspace if it has rights) but the user won't be able to view reports that connect to a gateway data source. When the user attempts to do so, Power BI will show an error that it...
-
Power BI Embedded
April 7, 2016 / No Comments »
Embedding reports is an extremely popular scenario for ISVs and developers coding external (customer-facing) applications. As I wrote a while back in my "Power BI Embedded Dashboards Without Authentication UI" blog, Power BI supports REST APIs that allow developers to embed dashboards and reports. However, these APIs don't support custom security so you have to provision users with Power BI. Furthermore, a hybrid architecture (reports definitions in the cloud and data on premises) requires Power BI Pro license for each user. This pricing model could quickly become overly expensive if you have to onboard hundreds of users. Power BI Embedded, available for preview on April 1st, aims to remove these obstacles. Designed as an Azure service, it doesn't require changes to the application security. For example, if your application uses Forms Authentication, users can still continue logging in using a user name and password. The application then calls the Azure APIs...
-
Power BI SandDance Visual
March 27, 2016 / No Comments »
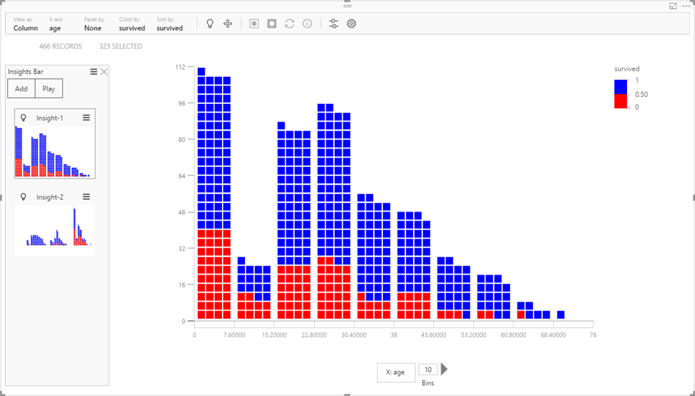
One of the announcements from the Data Insights Summit was the SandDance custom visual. Originating from Microsoft Research and coded in SVG, it not only allows you to visually explore data in versatile ways but it also demonstrates how far your custom visuals can go. This is a super visual that combines multiple visualizations, including column chart, grid, scatter chart, density chart, stack chart, and squarify chart (similar to Treemap) visualization. It also demonstrates animations and storytelling with data. You can test the visual outside Power BI with some predefined datasets by going to https://sanddance.azurewebsites.net. Or, you can download it from the Power BI Gallery and try it with your data in Power BI Desktop and Power BI service. When you compare visualization tools, pay attention to how open their capabilities are. Power BI provides several extensibility features. Custom visuals let any web developer extend the Power BI visualization features...
-
Power BI Measure Dimensions
March 24, 2016 / No Comments »
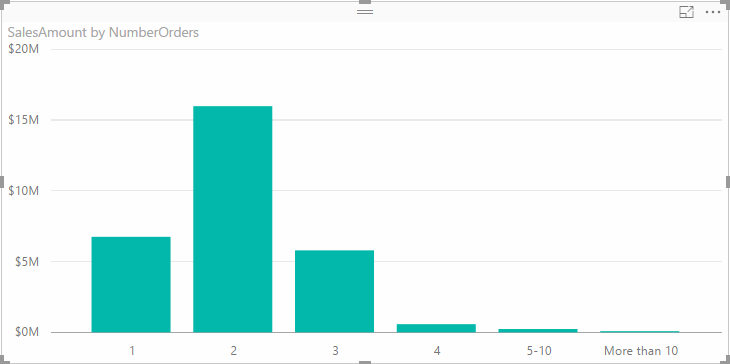
I had an inquiry about how to implement in Power BI/Power Pivot/Tabular something similar to the new Level of Detail (LOD) Expressions feature in Tableau 9.0. A more generic question would be how to turn a measure into a dimension so that you can analyze your data by the distinct values of the measure. Now, in my opinion, most real-life requirements would go beyond just using the distinct values. For example, the first sample Tableau report demonstrates a banding example. But what if you want to group measure values into "buckets", e.g. 1, 2, 3, 4, 5-10, 10-20, etc? Fortunately, DAX has supported powerful expressions since its very beginning. To make the code more compact, the example below uses DAX variables, which were introduced in Power BI Desktop and Excel 2016. However, you don't have to use variables if you use a lower version of Excel. The sample model (attached) has...
-
Atlanta MS BI Group Meeting on Mar 28th
March 24, 2016 / No Comments »
Atlanta MS BI fans, join me for the next Atlanta MS BI Group meeting on Mar 28th and 6:30 PM. Luis Figueroa will show us how to do cloud ETL with Azure Data Factory. Allegient will sponsor the event. Don't forget to register at atlantabi.sqlpass.org. ate this meeting http://aka.ms/PUGSurvey, PUG ID: 104 Presentation: A Closer Look at Azure Data Factory Level: Intermediate Date: Monday, March 28th, 2016 Time 6:30 – 8:30 PM ET Place: South Terraces Building (Auditorium Room) 115 Perimeter Center Place Atlanta, GA 30346 Overview: Azure Data Factory is a modern data orchestration platform design to help you manage any data of any size from any source. It also makes a number of technologies available to you such as Azure Machine learning so that you can integrate predictive machine learning models in your data pipelines. This platform enables you to create intelligent applications that not only provide insights...
-
Power BI Hybrid Architecture
March 23, 2016 / No Comments »
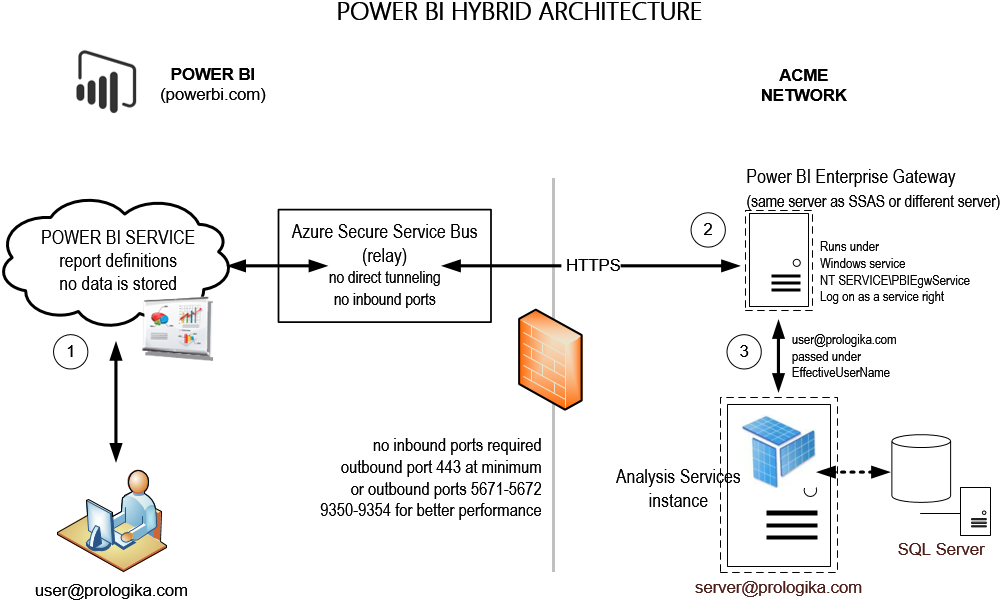
A unique and tremendously useful Power BI feature allows you to implement hybrid solutions where your data remains on premises (SSAS, SQL Server, Oracle, and other data structures) but only report and dashboard definitions are deployed to powerbi.com. This hybrid architecture gives you the best of both worlds: cutting edge cloud-based visualizations with on-premises security, scale, and single version of truth. Since no cloud application can connect directly to your network, a connectivity software, called Power BI Enterprise Management Gateway, acts as a bridge between powerbi.com and your data sources. I'm wrapping up a Power BI Hybrid Architecture proof of concept (POC) for a large organization and I want to recap some important lessons learned: I'm really astonished by the roundtrip speed! It's remarkable that the round trip completes so fast given that powerbi.com (a data center in Virginia for East Cost I believe) connects to a data center in...
-
Tabular Display Folders
March 17, 2016 / 2 Comments »
A welcome usability enhancement in SQL Server 2016 Tabular is the ability to configure display folders to organize table fields and measures in logical folders. Previously, you had to use BIDS Helper or DAX Editor (for measures) to implement display folders. Starting with SQL Server 2016, you can just set the Display Folder property of a measure or a field. This adds the display folder to Fields List in Excel and Power BI Desktop.
-
Two New Prologika Training Courses
February 29, 2016 / No Comments »
Due to popular demand, we've added two more classes to our training curriculum. Applied SQL Fundamentals - This 2-day instructor led course provides you with the necessary skills to query Microsoft SQL Server databases with Transact-SQL. This course starts with the basics of a SELECT statement and its syntax, and progresses to teach you how to join, aggregate, and convert data. This course is perfect for developers who need to query SQL Server databases to retrieve data, from complete beginners through to more experienced developers who can use some of the modules as reference material. It will benefit novice Database Administrators, Database Developers, and Business Intelligence professionals. It will also benefit SQL power users who need to create SQL queries, including report writers, data analysts, and client application developers. Applied Microsoft BI - This 4-day class is designed to help you become proficient with the Microsoft BI toolset and acquire...
-
ATLANTA MS BI GROUP MEETING ON FEB 29TH
February 26, 2016 / No Comments »
Atlanta MS BI fans, join me for the next Atlanta MS BI Group meeting on Feb 29th and 6:30 PM. I'll present "What's New in SSRS 2016". Don't forget to register at atlantabi.sqlpass.org. Nevron will be our sponsor. Vishal Pawar will do us a quick Prototypes with Pizza demo about the new features in the Power BI Feb update. Rate this meetinghttp://aka.ms/PUGSurvey, PUG ID: 104Presentation:What's New in Reporting Services 2016 Level: IntermediateDate:Monday, February 29th, 2016Time6:30 – 8:30 PM ETPlace:South Terraces Building (Auditorium Room) 115 Perimeter Center Place Atlanta, GA 30346Overview:Reporting Services plays an important role in the updated Microsoft on-premises BI roadmap as a platform for delivering paginated, mobile, and interactive reports. This is a great news for many customers who previously had to rely on SharePoint for BI. Microsoft has made significant investments in SQL Server 2016 to bring Reporting Services up to its new role. Join this session to...
-
Getting Mobile Reports to Recognize SSAS Dates
February 25, 2016 / No Comments »
Scenario: Some of the controls in SSRS 2016 mobile reports (previously known as Datazen) require a date field. The Mobile Publisher would refuse binding the control to an SSAS shared dataset if a column of a Date data type is not present. That's because when you create a dataset, you write an MDX query and MDX returns the field name as a string. Solution: You can use add a calculated member to the query that returns the MEMBER_VALUE property. MEMBER_VALUE returns in the underlying data in its native data type. For this to work in Multidimensional, you need to set the Value property of the Date attribute of your Date dimension to an underlying column of a Date data type. The following example, shows a sample query that uses the Adventure Works Tabular model. WITH MEMBER [Measures].[Total Sales] as ([Measures].[Internet Total Sales] + [Measures].[Reseller Total Sales]) MEMBER DateCasted as Iif([Measures].[Total...

We offer onsite and online Business Intelligence classes! Contact us about in-person training for groups of five or more students.