
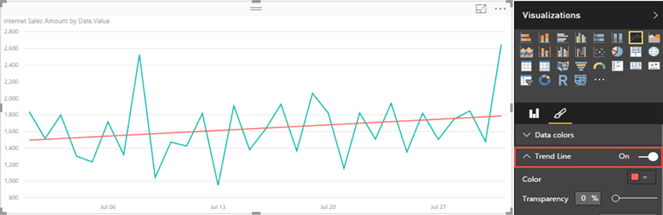
Recently, Power BI charts introduced trend lines. However, they require numeric or date values on X-axis, which must have a continuous type. In fact, if you use a text field for the X-axis, a warning indicator will be displayed in the top left corner of the chart to warn you that non-numeric values are used.
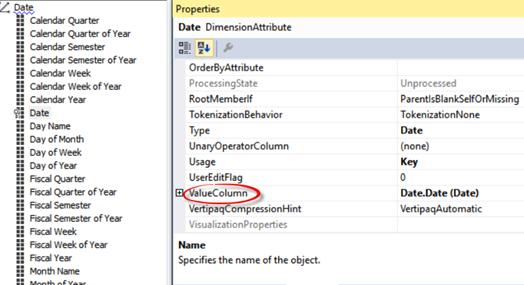
This requirement presents issues if the report is connected to a Multidimensional cube because by default all attributes are text-based. As a workaround, in the Multidimensional project set the ValueColumn property of the attribute to a column in the underlying table of a numeric or date data type, and deploy the cube.
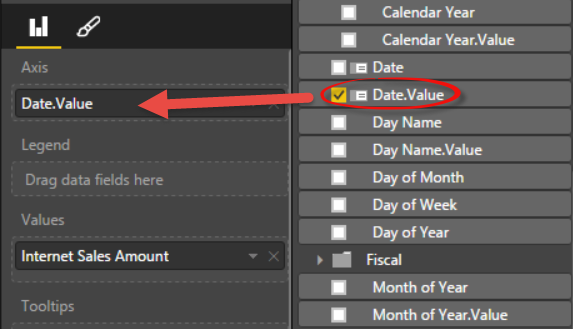
Back to Power BI Desktop, bind the corresponding .Value field to the X-axis.



JOIN THE CONVERSATION
Discussion