Handling Dates in BISM Tabular

[View:https://prologika.com/CS/cfs-file.ashx/__key/CommunityServer.Blogs.Components.WeblogFiles/blog/2308.AdventureWorks.zip:550:0]If you have experience with multidimensional cubes, you know that most cubes have a Date dimension grained at a day level. If the fact table has multiple date keys, you can join the Date dimension multiple times to the measure group so the Date dimension can play multiple roles (a role-playing dimension), such as OrderDate, ShipDate, and DueDate. If you use Excel pivot reports connected to the cube, to get support for dates you need to make the following changes as explained in Designing SQL Server 2005 Analysis Services Cubes for Excel 2007 PivotTables:

  1. Set the Type property of the Date dimension to Time. This is also required for MDX time-related functions, such as YTD.
  2. Set the ValueColumn column of the Date key to a column of date data type.

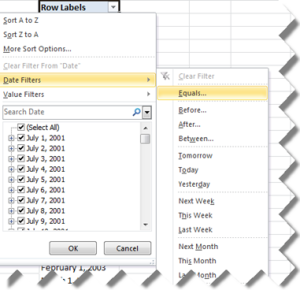
Once this is done, Excel “understands” the date semantics and treats dates as dates when you sort and filter on any field from the Date dimension. It also shows a nice menu for time calculations (relative dates).

103011_2341_HandlingDat1

But what if another dimension has a date attribute, such as the customer’s birth date? Unfortunately, Excel won’t recognize this field as of date type and it will treat as text. Not good, but these are the limitations of Excel OLAP pivot reports.

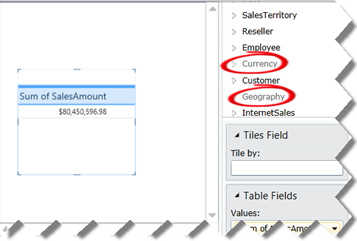
How does BISM Tabular change things as far handling dates? Starting with SQL Server 2012 and PowerPivot version 2, you can mark a table as a Date table. In the process of doing so, you need to specify a unique identifier. Once this is done, you get the same support for dates with Excel pivot reports because they are actually OLAP pivot reports that see BISM Tabular models as cubes. Specifically, Excel will treat only fields from the Date table as dates. Take for example the following model (attached in the blog):

103011_2341_HandlingDat2

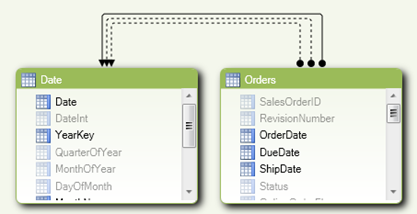
The Orders table has three date fields (OrderDate, DueDate, and ShipDate). In SQL Server 2012, BISM Tabular and PowerPivot support multiple joins between tables, as Kasper de Jonge explains in his PowerPivot Denali: Working with multiple relationships between two tables blog. Well, kind of, because only one join can be active (the one in the solid line). The other dotted relationships can be used for DAX calculations, such as SalesAmountByDueDate, SalesAmountByShipDate, etc. In other words, BISM Tabular doesn’t support true role-playing tables and you won’t get automatically DueDate and ShipDate instances of the Date table. You can import the Date table multiple times but only one table can be marked as a Date table. However, Power View (code-named Crescent) is designed from ground up to support natively BISM Tabular models. Consequently, the Excel date limitations disappear, as shown in the table below.

Date FeaturesExcelPower View
Date typesOnly in Date tableAll tables
Relative DatesOnly in Date tableN/A


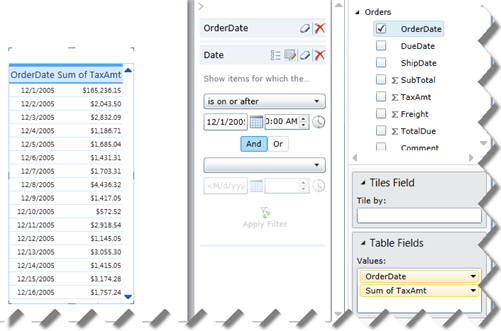
Power View treats any Date field as a date. For example, this Power View report shows the OrderDate and TaxAmt fields from the Order table. The OrderDate field is of date data type. As you can see, I can filter on dates after a given date and Power View shows the correct results. Unfortunately, Power View doesn’t support relative dates as Excel does so you must define DAX time calculations.

103011_2341_HandlingDat3

In short, here are some recommendations to get the most of dates:

  1. If you need to support multiple dates, leave the columns as a of date data type. Don’t use integer keys or smart keys, which are a common practice in data warehousing, to join to the Date table.
  2. Have a Date table that joins to the date that is mostly commonly used so users can aggregate by quarters, years, etc. Make sure that the date columns in the other tables don’t include times because you won’t be able to join 10/19/2011 8:40 PM to 10/19/2011. If you need to have the same support for the other dates, reimport the Date table multiple times.
  3. Consider creating inactive relationships for the other dates to be able to implement DAX calculations.
  4. Use Power View for reporting. Besides better handling of dates, Power View will give you better performance with transactional reporting, as I explained in my Transactional Reporting with BISM Tabular blog.

BTW, speaking of dates and BISM Tabular, Boyan Penev (MVP SQL Server) has implemented a nice Date Stream feed on Azure Data Market. If you decide to consume the feed, you would notice that the DateKey column is returned as ISO8601 date (such as 2011-10-29T00:00:00. Unfortunately, Excel doesn’t recognize the ISO8601 format. You might think that you can around this predicament by creating a calculated column that removes the time portion but you can use a calculated column as a unique identifier in the Date table. As a workaround, save the feed as a file and strip out the time portion so you can set the data type to Date.

Reporting Services Data Alerts

SQL Server 2012 introduces a Reporting Services feature called Data Alerts. Data alerts notify a selected list of recipients about data changes on the report. Behind the scenes, data alerts use the report data feeds feature which was introduced in SQL Server 2008 R2. Consequently, similar to subscriptions, data alerts run in the background and poll the reports for changes. For more information about the data alerts architecture, read the Data Alerts (SSRS) topic in BOL.

The steps to create a data alert for the Company Sales 2008 report follow (note that creating alerts require View Items and Create Alerts SharePoint permissions):

  1. Open the report in SharePoint.
  2. Expand the Actions menu and click New Data Alert.

    103011_0010_ReportingSe1

    Reporting Services opens the New Data Alert dialog box. The Report Data Name drop-down list shows all data regions defined on the report. In the case of the Company Sales report, there is only one data region – Tablix1. In addition, Reporting Services shows you the data that feeds the region based on the report parameters selected.

    103011_0010_ReportingSe2

  3. In the right pane, click the Add Rule button to specify criteria for activating the alert. In my case, I want the alert to be triggered for the Accessories product category, Bike Racks product subcategory, year 2007, quarter Q4, and Sales greater than 70,000. As the report data shows, currently the Sales value for these criteria is 60,883.20. As new data is coming in, this value will probably increase and I want to be notified after it exceeds 70,000. I set the alert schedule to run on a daily basis (other options include Weekly, Hourly, or Minute).
  4. Next, you specify the e-mail addresses of the recipients who will get notified when the criteria are met and the e-mail subject text. Once you click Save, the alert is saved in the Reporting Services database and scheduled for execution with the SQL Server Agent. I can see and manage the alerts I’ve created by expanding the report context menu in SharePoint and clicking Manage Data Alerts.

    Reporting Services data alerts have the following limitations:

    1. They are only available in SharePoint. Reporting Services in native mode doesn’t support data alerts.
    2. They are supported with operational reports only, such as reports created by Report Designer or Report Builder and deployed to the SharePoint. Data alerts cannot be created on Power View reports.
    3. Similar to subscriptions and report caching, data alerts require stored credentials. Consequently, developers targeting BISM Multidimensional or Tabular must go through the same hoops (none of them easy) to use alerts with Analysis Services. If you are not happy about this limitation, please vote for my suggestion on connect.microsoft.com that is time for Microsoft to address this limitation.

SQL Server 2012 data alerts extend the Reporting Services capabilities to poll reports and trigger notifications when report data changes. If you target data sources that require standard security (login and password), the feature is very easy to use and business users will probably love it.

Partition Generator for Multidimensional Cubes

Today happens to be my birthday. To reverse the tradition, how about I give you a gift? If you find yourself spending hours creating partitions in BIDS, you might find the Partition Generator sample (requires registration at the Prologika website) useful. Often, I partition larger cubes by month which may require creating quite a few partitions. Not only is this time-consuming and tedious, but is also error-prone as you can easily get the partition slice query wrong. Written as a C# console application, Partition Generator has the following design goals:

  1. Keep it simple on purpose and due to time constraints. So, no GUI yet and you need to have basic .NET coding skills. You will need Visual Studio 2008 or later with C# to configure it.
  2. Auto-generate a partition definition file in an offline mode without making changes to the server by default. You can use this file to replace the *.partitions file in BIDS so the partitioning scheme can become a part of your project.
  3. Support an online mode where you can deploy the partition changes to the server.

Configuring Partition Generator

Configuring partition generator requires opening the source and making changes to reflect your environment. Specifically, you need to update the following variables:

static string _server = “<your server>”; // SSAS server where the cube is deployed

static string _database = “<database>”; // SSAS datasbase

static string _cube = “<cube>”; // SSAS cube to partition

static string _measureGroup = “<measure group>”; // Measure group to partition

static string _dataSource = “<data source name>”; // The data source name

static DateTime _dateStart = new DateTime(2007, 1, 1); // start date for the period

static DateTime _dateEnd = new DateTime(2020, 12, 31); // end date for the period

// the partition query

static string _query = SELECT * FROM [dbo].[FactInternetSales] WHERE OrderDateKey ;

Note that you need a live cube to connect to which can be partitioned or not partitioned (default partition only). The start date and end date variables specify the start date for the first partition and end date for the last partition respectively. By default, Partition Generator will partition by month but you can overwrite this in code by changing the following line:

_dateStart = _dateStart.AddMonths(1); // assuming parititon by month

Partition Manager creates also start and end partitions for dates outside the date range which could be handy if you forget to add partitions after the end date is passed. Partition Generator sets also the partition slice which is a recommended performance-optimization technique.

Updating the Project

Once you configure Partition Generator, run it with Ctrl+F5. It uses AMO to retrieve the cube metadata and generates a partitions.xmla file in the project bin\debug folder.

  1. Double-click the partitions.xmla to open it in SQL Server Management Studio.
  2. Find and collapse the Partitions XML element. Select the Partitions element and press Ctrl+C to copy its content.

    102411_2129_PartitionGe1


  3. Back up your SSAS project. Open your SSAS project in BIDS. In Solution Explorer, click Show All Files.
  4. Expand the Cubes folder, right-click the <cube name>.partitions file and click View Code to open its source.
  5. Find and select the entire Partitions element for the measure group you want to partition,  and press Ctrl+V to replace the source with new partition schema which you copied in SSMS.
  6. Save the project and close BIDS. That’s because BIDS doesn’t handle well changes made directly to the source files.
  7. Open the SSAS project again in BIDS. Open your cube in the Cube Designer and click the Partitions tab. You should see the new partitions.

Deploying Partitions

By default, Partition Generator doesn’t change the deployed cube. It reads metadata only. However, you can be configured to deploy the partition changes. This could be useful when you want to experiment with different partitioning schemes, such as by month, quarter, year, etc. To configure Partition Manager to deploy the changes:

  1. In the PartitionGenerator project, right-click the PartitionGenerator project node in Solution Explorer and click Properties.
  2. In the Project Properties dialog box, select the Build tab and define a RELEASE conditional compilation symbol as follows:

    102411_2129_PartitionGe2

  3. Run Partition Manager to generate both the partitions.xmla file and apply the changes to the SSAS server.

I haven’t tested Partition Manager with BISM Tabular. It should work since Tabular uses the same Partition element in the model (*.bim) file. One more thing – Partition Manager is not supported so please use it at your own risk.

Enjoy!

Book Review: MDX with Microsoft SQL Server 2008 R2 Analysis Services Cookbook

8053.MDX%20cookbook%20200%20x%20247.png-200x0MDX is the query language for multidimensional cubes. Many BI practitioners perceive MDX to have a high learning curve probably not that much for the language itself but for the multidimensional concepts you need to master before you can get something out of it. When interacting with the community, I am frequently asked to recommend a MDX book. So far, my recommendations have been Microsoft SQL Server 2008 MDX Step by Step by Brian Smith at el for beginners and MDX Solutions by George Spofford at el for more advanced users.

I will add MDX with Microsoft SQL Server 2008 R2 Analysis Services Cookbook by Tomislav Piasevoli (MVP – SQL Server) to my recommendation list. This book takes an interesting approach that will be particularly appealing to readers who have already mastered the basics. As its name suggests, the book is a collection of recipes that you can quickly refer to when you tackle a specific MDX requirement. For example, suppose you need to obtain the last date with data in the cube. You flip to Chapter 2: Working with Time and you find a section Getting Values on The Last Date With Data. In it, the author provides the necessary background to explain the concept and provides a 9-step recipe for implementing it. Besides its practical and concise style, another thing that I liked about this book is that it targets the Adventure Works cube so you don’t have to spend time installing and learning other databases. You can hit the ground running by just copying and executing the query.

All in all, this is great book to add to your repertoire of Analysis Services books. The author is an industry-recognized expert who has many years of experience in developing BI solutions with Analysis Services and this becomes evident quickly. Get the recipes!

Disabling Foreign Key Constraints

Disabling check constraints, such as foreign key constraints, is often required when populating a data warehouse. For example, you might want to disable a check constraint to speed up loading of a fact table.

  1. How do we disable check constraints in SQL Server?
    You can script each check constraint or you can use the undocumented sp_MSforeachtable function.

    ALTER
    TABLE [dbo].[FACT_ITEM_INVENTORY] NOCHECK
    CONSTRAINT [FK_DIM_DATE_FACT_ITEM_INVENTORY_Date_Id] — disables a specific contraint

    sp_MSforeachtable
    ‘ALTER TABLE ? NOCHECK CONSTRAINT ALL’ — disables all contraints in the database

    Once the foreign keys are disabled, you can run the ETL job or delete records from the referenced table without referential integrity checks. Note that you cannot truncate a table even if you have disabled the constraints due to the different way SQL Server logs the truncate operation. You must drop the constraints if you want to truncate a table. You can use sp_MSforeachtable to drop constraints as well although I personally prefer to disable them for a reason that will become obvious in a moment.

  2. How do we enable check constraints?

The same way you disabled them but this time you use the CHECK predicate:

ALTER
TABLE [dbo].[FACT_ITEM_INVENTORY] CHECK
CONSTRAINT [FK_DIM_DATE_FACT_ITEM_INVENTORY_Date_Id] — enables a specific constraint

sp_MSforeachtable
‘ALTER TABLE ? CHECK CONSTRAINT ALL’ — enables all contraints in the database

  1. Does SQL Server verify referential integrity for existing data when you re-enable check constraints?

    This is where the behavior differs between recreating and enabling constraints. If you drop and create the constraints, the server will check the data unless WITH NOCHECK is used.

    ALTER
    TABLE [dbo].[FACT_ITEM_INVENTORY] WITH
    NOCHECK

    ADD
    CONSTRAINT [FK_DIM_DATE_FACT_ITEM_INVENTORY_Date_Id] FOREIGN
    KEY([Date_Id]) REFERENCES [dbo].[DIM_DATE] ([Date_Id])

    The server doesn’t check existing data if you enable a previously disabled constraint. You can manually check foreign key violations by using this command:

    dbcc
    checkconstraints(FACT_ITEM_INVENTORY) –- checks a specific table

    dbcc
    checkconstraints — checks the entire database

The checkconstraints command will output all rows that violate constraints.

UPDATE 10/31/2011

Reader Ian pointed out that re-enabling foreign key constraints without checking data marks them as non-trusted. Consequently, the SQL Server optimizer may choose different execution plans for a certain range of queries. Tibor Karaszi explains this in more details in his blog Non-trusted constraints and performance. Paul White also mentions about a bug in this area. This makes me believe that enabling check constraints without checking data should be avoided. Therefore, to speed up fact table imports for large dataset consider:

  1. Disable foreign key constraints
  2. Drop indexes on fact tables
  3. Import data
  4. Recreate indexes on fact tables
  5. Re-enable constraints with the WITH CHECK option


sp_MSforeachtable

‘ALTER TABLE ? WITH CHECK CHECK CONSTRAINT ALL’ — enables all constraints in the database

Power View Automatic Metadata Filtering

Similar to Report Builder models (now obsolete), Power View (formerly known as Crescent) filters metadata automatically. The reasoning behind this feature is that the tool should guide the user to choose only tables that are related to the ones used on the report to avoid Cartesian joins. For example, if the user has selected Sales Amount from the Reseller Sales table, Power Pivot automatically disables Currency and Geography tables because they are not related to the Reseller Sales table. The Metadata pane shows these tables greyed out and the user cannot choose a column from these tables.

101911_0020_PowerViewAu1

As useful as this feature is, it can get in the way for the same reasons the Report Builder metadata filtering didn’t work so well with multidimensional cubes. Marco Russo has already reported an issue that this feature ignores M2M calculations in the model. I believe this will be even a bigger issue one day when Power View supports multidimensional cubes because there are scenarios where dimensions are not directly related to a fact table but still can be used for slicing, such as a shim dimension for time calculations that is populated with scope assignments.

If you agree, please vote for the suggestion I’ve submitted on connect. Ideally, there should be a visual indicator that a table is not related but the user should still be able to select a column. Or, the modeler should be able to overwrite this behavior per table.