Prologika is a BI and Analytics Innovation Awards Finalist!
Content will be added soon.
Content will be added soon.
Microsoft has been awarding Teo Lachev the prestigious Microsoft Most Valuable (MVP) award every year since 2004 for his expertise and contribution to the community.
Come and join me on Saturday, January 9 th at the first SQL Saturday BI edition in Atlanta. You’ll learn about the exiting new BI changes coming to SQL Server 2016 and the Microsoft on-premises roadmap!
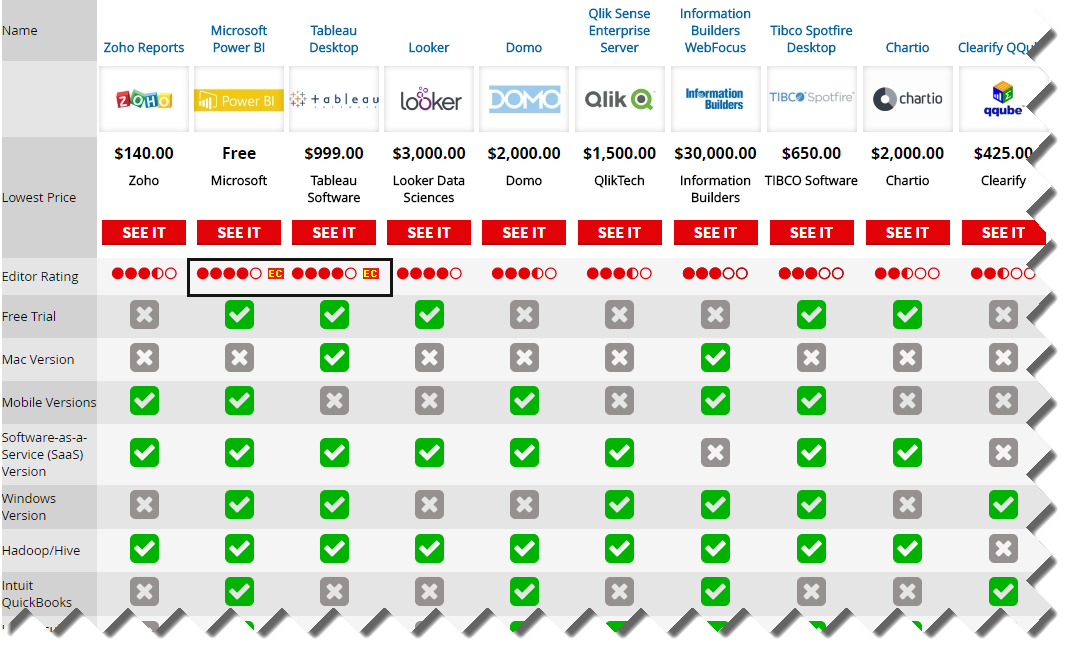
I came across this interesting PC Magazine article that just came up to compare 10 popular self-service BI tools. And the winner is? Power BI, of course, rubbing shoulders with Tableau for the Editor Choice award! The author, David Strom, did a great job reviewing the tools (this is not a trivial undertaking) but a few Power BI conclusions deserve clarifications:
Speaking about reviews, here are some important Power BI characteristics that make it stand above the rest of the pack:
Scenario: You might have imported a custom visual in Power BI Desktop, tested it, and decided not to use it. However, even if your reports don’t use the visual anymore, Power BI will still prompt you if you want to enable custom visual with “This report contains a custom visual not provided by Microsoft…”. This is a security warning to avoid malicious code because custom visuals are deployed in Javascript.
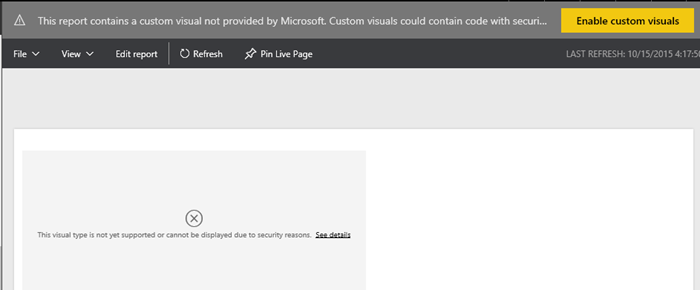
Currently, there is no way in Power BI to disable this prompt. To make things worse, neither Power BI Service nor Power BI Desktop have a feature to get rid of the custom visual once it’s added to a Power BI Desktop file.
Solution: Here are the manual steps are followed to get rid of custom visuals in Power BI Desktop file for good:
Now when you deploy the PBI Desktop file to Power BI and view its reports, you shouldn’t get prompted anymore.
Scenario: You’d want to have user-friendly field names in Tabular, Power Pivot, and Power BI Desktop, such as Claim Amount as opposed to database column names, such as ClaimAmount or Claim_Amount. Multidimensional has a feature that automatically delimits words with spaces when it detects a title case or underscore but Tabular lacks this feature. While you can rename fields in Tabular on field at the time, each step requires a commit action, thus taking long time to rename all fields.
Solution: While I’m not aware of a tool for renaming fields, the following approach should minimize the tedious work on your part:
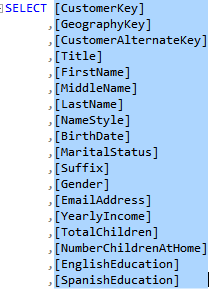
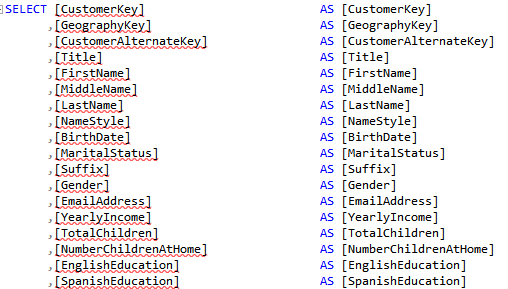
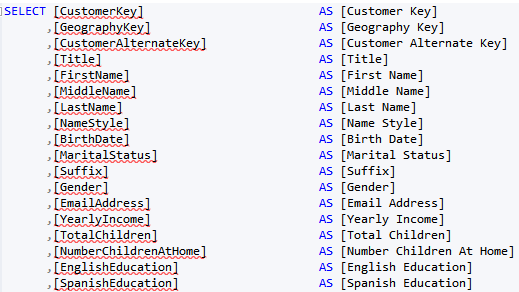
The regular expression I use is not perfect. It won’t discriminate capital letters; for example, it will delimit consecutive capital letters, such as ID as I D, but it’s faster to fix the exceptions than doing all replacements manually. And if you end up with a better expression, please send it my way. The last step, of course, is to import the view and not the table in Tabular, Power Pivot, or PBI Desktop.
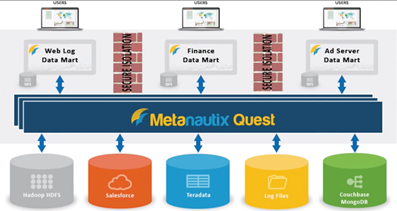
If you’ve missed the announcement from a couple of weeks ago, Microsoft acquired Metanautix – a startup founded by ex-Google engineers who worked on BigQuery (aka Dremel). Technical details are scarce at point. In fact, the Metanautix website doesn’t exist anymore but there are YouTube videos and slides, such as this one. A while back, I wrote about logical data warehouses, which come in different shapes and names, such as software-defined data marts, distributed data, and, what I call, brute-force queries, such as Amazon QuickSight. It looks like that with this acquisition, Microsoft is hoping to make a step in this direction, especially when it comes to Big Data analysis.
From I was able to gather online to connect the pieces, Metanautix Quest uses a SQL-like language to define tables that point to wherever the data resides, such as in HDFS, flat files, or RDBMS. The syntax to define a table might like this:
DEFINE TABLE t AS /path/to/data/*
SELECT TOP(signal1, 100), COUNT(*) FROM t
I believe that the original Google implementation would leave the data on the Google File System (GFS). However, it looks like Metanautix always brings the data into an in-memory columnar store, similar to how Tabular stores the data. When the user sends a query (the query could relate data from multiple stores), a multi-level serving tree algorithm is used to parallelize the query and fetch the data with distributed joins, as described in more details in the “Dremel: Interactive Analysis of WebScale Datasets” whitepaper by Google. According to the whitepaper, this query execution pattern outperforms by far MapReduce queries.
While I was reading about Metanautix, I couldn’t help but ask myself “how is it different than Tabular if it brings the data in?” Yet, from the announcement:
“With Metanautix technology, IT teams can connect a diversity of their company’s information across private and public clouds, without having to go through the costly and complex process of moving data into a centralized system.”
It might that Metanautix is more scalable when it comes to Big Data although I don’t see how this could happen if the data is not in situ. We shall see as details start coming in. “In the coming months, we will have more to share about how we will bring Metanautix technology into the Microsoft data platform, including SQL Server and the Cortana Analytics Suite” One thing is for sure: as with logical data warehouses, Metanautix won’t solve your data integration challenges and it’s not a replacement for DW. From what I can tell, it could help with ad hoc analysis across distributed datasets without having to build analytical models, with all the pros and cons surrounding it.