One of the announcements from the Data Insights Summit was the SandDance custom visual. Originating from Microsoft Research and coded in SVG, it not only allows you to visually explore data in versatile ways but it also demonstrates how far your custom visuals can go. This is a super visual that combines multiple visualizations, including column chart, grid, scatter chart, density chart, stack chart, and squarify chart (similar to Treemap) visualization. It also demonstrates animations and storytelling with data. You can test the visual outside Power BI with some predefined datasets by going to https://sanddance.azurewebsites.net. Or, you can download it from the Power BI Gallery and try it with your data in Power BI Desktop and Power BI service.
When you compare visualization tools, pay attention to how open their capabilities are. Power BI provides several extensibility features. Custom visuals let any web developer extend the Power BI visualization features with “widgets” that can leverage popular visualization frameworks, such D3.js and SVG. Do other vendors let you do this?
I had an inquiry about how to implement in Power BI/Power Pivot/Tabular something similar to the new Level of Detail (LOD) Expressions feature in Tableau 9.0. A more generic question would be how to turn a measure into a dimension so that you can analyze your data by the distinct values of the measure. Now, in my opinion, most real-life requirements would go beyond just using the distinct values. For example, the first sample Tableau report demonstrates a banding example. But what if you want to group measure values into “buckets”, e.g. 1, 2, 3, 4, 5-10, 10-20, etc?
Fortunately, DAX has supported powerful expressions since its very beginning. To make the code more compact, the example below uses DAX variables, which were introduced in Power BI Desktop and Excel 2016. However, you don’t have to use variables if you use a lower version of Excel. The sample model (attached) has three tables: FactInternetSales, DimCustomer, and DimDate. The scenario is to analyze data by a NumberOrders band that discretizes the number of orders the customers have placed over time. The trick is to add a calculated column to DimCustomer which has the following DAX formula:
This expression defines a SumOrders variable whose expression calculates the number of orders each customer has in FactInternetSales. Because the grain of FactInternetSales is a sales order line item, we need to use DISTINCTCOUNT. Then, for more compact syntax, instead of using a bunch of nested IF functions, we use the SWITCH function to evaluate the value of the SumOrders variable and create the bands. This is where the variable comes handy. If you don’t have a variable, you need to create a separate measure for CALCULATE ( DISTINCTCOUNT ( FactInternetSales[SalesOrderNumber] ) ) and use this measure so you don’t repeat the same formula in the SWITCH statement. Variables also has the advantage of evaluating the expression once so the expressions that reference them should perform better.
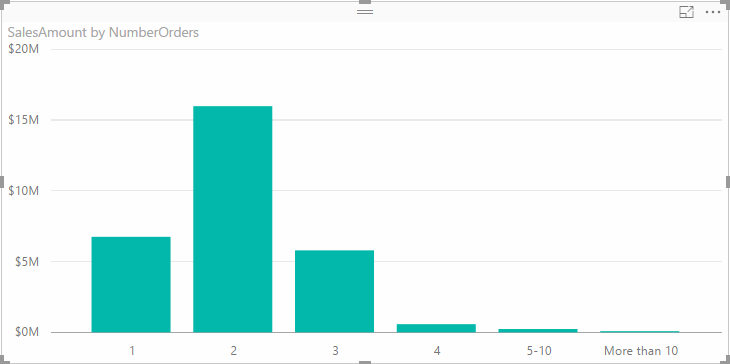
Now we can have a report that uses the measure dimension, such as to show sales by the number of orders.
Atlanta MS BI fans, join me for the next Atlanta MS BI Group meeting on Mar 28th and 6:30 PM. Luis Figueroa will show us how to do cloud ETL with Azure Data Factory. Allegient will sponsor the event. Don’t forget to register at atlantabi.sqlpass.org.
Azure Data Factory is a modern data orchestration platform design to help you manage any data of any size from any source. It also makes a number of technologies available to you such as Azure Machine learning so that you can integrate predictive machine learning models in your data pipelines. This platform enables you to create intelligent applications that not only provide insights but can also recommend actions upon specific events. Join me in this session as we take a closer look at many of the capabilities built into the platform.
Speaker:
Luis Figueroa serves as the Practice Lead for the Data Platform and Analytics division at Allegient, LLC. Luis is focused on delivering business solutions that leverage the Microsoft ecosystem of products. His areas of expertise are Data Warehousing, Business Intelligence, Big Data and Advanced Analytics. With 10+ years of experience in the field, Luis has delivered data management solutions for companies across many industry verticals. Luis is also a Microsoft P-TSP and chapter leader of the PASS Data Science Virtual Chapter.
Sponsor:
Allegient is a leading IT consulting firm that specializes in translating business objectives into technology solutions. We leverage proven technologies and methodologies that best align with your organization’s needs, resources and timeline. Focus areas include Business Process Management, Business Intelligence, Collaboration, Relationship Management (CRM/xRM), Custom Application Development & Sustainment, and IT Service/Project Management.
https://prologika.com/wp-content/uploads/2016/01/logo.png00Prologika - Teo Lachevhttps://prologika.com/wp-content/uploads/2016/01/logo.pngPrologika - Teo Lachev2016-03-24 08:55:392016-03-24 08:55:39Atlanta MS BI Group Meeting on Mar 28th
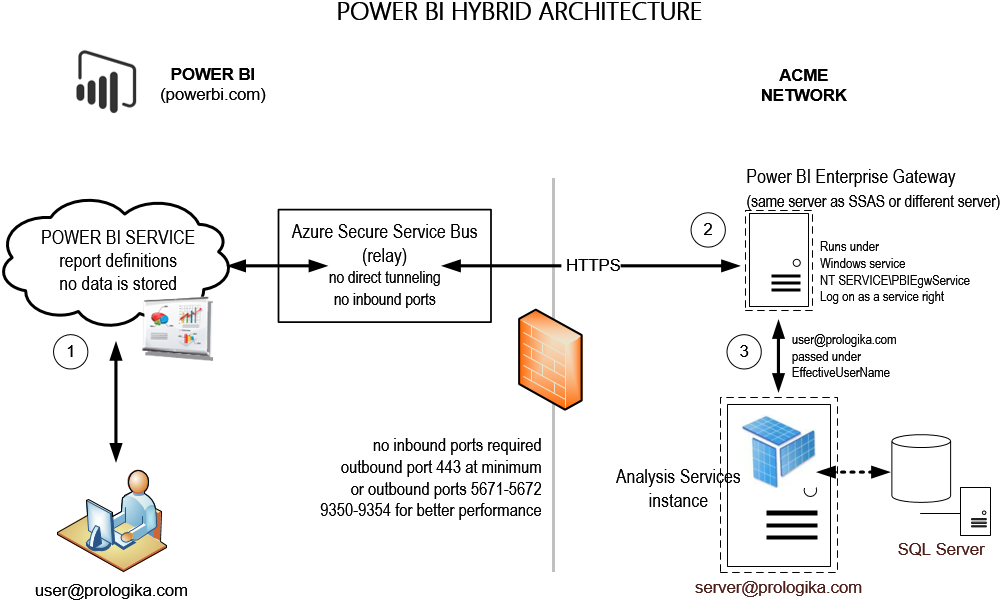
A unique and tremendously useful Power BI feature allows you to implement hybrid solutions where your data remains on premises (SSAS, SQL Server, Oracle, and other data structures) but only report and dashboard definitions are deployed to powerbi.com. This hybrid architecture gives you the best of both worlds: cutting edge cloud-based visualizations with on-premises security, scale, and single version of truth. Since no cloud application can connect directly to your network, a connectivity software, called Power BI Enterprise Management Gateway, acts as a bridge between powerbi.com and your data sources.
I’m wrapping up a Power BI Hybrid Architecture proof of concept (POC) for a large organization and I want to recap some important lessons learned:
I’m really astonished by the roundtrip speed! It’s remarkable that the round trip completes so fast given that powerbi.com (a data center in Virginia for East Cost I believe) connects to a data center in Atlanta. Granted, not much goes across the wire. Power BI sends a DAX query and SSAS sends summarized results. Still, latency is not an issue. As another customer puts it, “the Power BI reports have better performance than our on-premises SharePoint reports”.
Power BI Enterprise Gateway uses the Azure Secure Service Bus relay connection. What this means for you is that you don’t have to open any incoming ports on your company’s firewall. When the gateway establishes an outbound connection, it scans the available outbound ports. If the only port open is 443 (HTTPS), then it uses this port. Because port 443 might be heavily used, you can open outbound ports 5671-5672 and 9350-9354 for better performance. However, I didn’t see any performance degradation with port 443. This is another remarkable performance observation given that this organization has thousands of computers that use this port when connecting to Internet.
The only setup snag I encountered was this organization uses a proxy that is configured for Basic Authentication only and gateway failed to connect on a first try. I had to create a .NET assembly that returns the credentials of an account with permissions to the proxy using the module configuration element. If your organization doesn’t use a proxy or it does, but the proxy supports NTLM security, you won’t have this issue.
The gateway can be installed on the same machine as the data source or another machine. I recommend installing it on a different machine for an additional level of security. Since one gateway can access multiple data sources, a dedicated gateway server makes more sense. Currently, the gateway service is not fault tolerant but you can install another gateway instance on another machine that services the data sources that need to be highly available.
By default, the gateway runs under a NT SERVICE\PBUEgwService account that the gateway setup creates. You can use another Windows account of course. It needs to have a “Log on as service” right and it needs to be a member of the Performance Log Users local group. The gateway should have no issue running as another low-privileged account, such as LocalService.
Besides the setup requirements and limitations when connecting to SSAS, creating a data source requires hardcoding the credentials of a Windows account that has admin rights to SSAS to delegate the user identity via EffectiveUserName so that SSAS data security works. This might present an issue if your organization has a password expiration policy for service accounts (typically this is not the case bus this organization has to comply to regulations and customer service contracts). I suggested to Microsoft to support another option that would allow connecting to SSAS using the gateway service account via NTLM security. This would allow you to use a managed service account for the gateway service whose password expiration is managed by the domain controller.
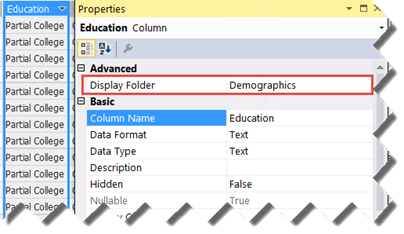
A welcome usability enhancement in SQL Server 2016 Tabular is the ability to configure display folders to organize table fields and measures in logical folders. Previously, you had to use BIDS Helper or DAX Editor (for measures) to implement display folders. Starting with SQL Server 2016, you can just set the Display Folder property of a measure or a field.
This adds the display folder to Fields List in Excel and Power BI Desktop.
On a personal note, I’m excited to announce the launch of the new Prologika website (https://prologika.com), which adds a slew of new features to connect better with customers and readers, including site-wide search, responsive web design, case studies, book and blog discussion lists, and more to come. Although the old blog feed should still work, please update it to https://www.prologika.com/feed/. Continuing on the list of announcements, Microsoft added a Prologika Power BI case study to the Power BI partner showcase. Speaking of Power BI, I definitely see a lot of interest from customers in Power BI-based solutions, ranging from self-service BI to white-labeling and report embedding. Last but not list, our Atlanta MS BI group is an official Power BI group! So, if you’re interested in Power BI, check our monthly meetings which now feature more Power BI content.
Spring is here and it brings again a new version of SQL Server. Microsoft launched SQL Server 2016 on March 10th. Its product page include nice videos covering some of the new features. The great news is that the “box” has seen a renewed interest and Microsoft has made significant investments in all the bundled services to help you implement cost-effective and modern data analytics solutions on premises. In this newsletter, I’ll enumerate my favorite BI new features in SQL Server 2016. Feel free to also check my slides on this topic on my LinkedIn profile page.
Tools
The days of waiting years for the next SQL Server release are coming to an end, as you first witness with the client tools.
SSMS – You no longer have to run the SQL Server setup just to get SQL Server Management Studio (SSMS). SSMS is now available as a free and standalone download here. Moreover, it will be updated on a monthly basis and it will be backward compatible for all SQL Server supported versions!
SSDT – Also, to everybody’s delight, the BI add-on to SQL Server Data Tools (SSDT) is gone. Instead, you just download and install SQL Server Data Tools, which includes the BI projects. No more installing three setup packages to get to the BI stuff. To make your joy complete, SSDT is backward compatible. Actually, SSRS and SSAS have been backward compatible for a while, but now SSIS joins the list so that you can use SSDT to work with legacy SSIS packages.
Database Engine
There are many new features in the Database Engine but the following will be of particular interest to BI practitioners:
Updatable columnstore indexes – They will allow you to speed up aggregated queries without having to drop and recreate the columnstore index.
Live query statistics – How many times you had to troubleshoot the performance of massive query with many joins? Live query statistics will now show you which joins slows the query down.
Temporal tables – Anyone who’s implemented ODS knows that maintaining Type 2 changes is no fun. Temporal tables can maintain changes on any column for you. This feature is also great if you need data change auditing.
Integration with R – Leveraging the Revolution Analytics acquisition, the R Server allows your data analysts to run R scripts on top of the SQL Server data. Moreover, DBAs can configure resource limits so that these scripts don’t impact the database performance.
SQL Server Integration Services (SSIS) and Master Data Services (MDS)
I’m somewhat disappointed that the Power Query integration and Lineage Statistics didn’t make the cut. Anyway, here are my favorites:
Incremental project deployment – you can just deploy changed packages to the catalog instead of deploying the entire project.
Package parts – you can refactor some control flow tasks in reusable package parts that you can manage separately. This could be very beneficial for SSIS “frameworks” so that you don’t have to update all packages if some changes are introduced later in the development cycle.
Cloud tasks and connectors – Lots of attention to moving and transforming data in Azure. For example, there is a task that will allow you to move data to Azure Blog storage in the most efficient way. Continuing this line of thought, the fastest way to move the data to Azure SQL DW would be to use Polybase which supports HDInsight and Azure Blob Storage.
MDS Entity Sync – Allows you to reuse entities among models. For example, you can implement a Common model with entities, such as Geography, that you can configure for auto synchronization with other models.
15x performance increase in MDS Excel add-in.
SQL Server Reporting Services (SSRS)
As per the Microsoft’s updated reporting roadmap, SSRS comes out of the closet to fulfill its new role of becoming the on-premises platform for paginated (pixel-perfect), mobile, and Power BI Desktop reports (support for Power BI Desktop files in SSRS will happen after SQL Server 2016). SSRS saw a lot of attention in SQL Server 2016 and brings major new enhancements:
Better mobile support – SSRS reports now render in HTML5. Users can use the Power BI native apps for iOS, Android and Windows devices to render both SSRS and Power BI reports. ActiveX print control has been replaced with PDF printing that works on all modern browsers.
Facelift – SSRS 2016 brings a new report portal (aka Report Manager). Report Builder has a new look too. Charts and gauges have a new modern look. New chart types (Sunburst and Treemap) have been added. You can now add KPIs directly in the Report Portal.
Mobile reports – Thanks to the Datazen acquisitions, you can now have in the box reports that specifically target mobile devices, that have similar features as competing vendors, such as PushBI (now part of Tibco) and RoamBI.
Parameter area – You can now control the parameter placement. Personally, I expected also more control over parameters, such as parameter validation, but the alas, the wait is not over.
Prioritized native report mode – Microsoft now prioritizes SSRS in native mode which is a great news for customers who previously had to adopt SharePoint Enterprise just for BI. In fact, all the new features are available only in SSRS native mode.
SQL Server Analysis Services (SSAS)
As you know by now, I’m a big fan of classic BI solutions that feature a semantic layer (Multidimensional or Tabular). SSAS gets many new features, including:
Tabular many-to-many relationships – You can now implement M2M relationships by setting the relationship cross filtering direction to Both, as you can in Power BI Desktop.
Tabular Direct Query enhancements – Microsoft put a lot of effort to lift previous Direct Query limitations in Tabular so that you can build Tabular models on top of fast databases without having to cache the data. Direct Query now have better performance, support for row level security, support for MDX clients such as Excel, support for Oracle, Teradata, and Azure DW.
New Tabular scripting language – Tabular models are now described in a new lightweight JSON grammar. This speeds up scheme changes, such as renaming columns. In addition, a new Tabular Object Model (TOM) is introduced to help developers auto-generate Tabular models.
DAX new functions – Many new DAX functions (super DAX) were introduced.
Multidimensional – support for Power BI and Power BI Desktop. Support for Netezza as a data source. Distinct count ROLAP optimization for DB2, Oracle, and Netezza. Drillthrough is now supported with multi-selection, such as then the user filters on multiple values in Excel.
SQL Saturday Atlanta #521: A free training event for all things SQL Server on May 21st.
As you’d probably agree, the BI landscape is fast-moving and it might be overwhelming. If you need any help with planning and implementing your next-generation BI solution, don’t hesitate to contact me. As a Microsoft Gold Partner and premier BI firm, you can trust us to help you plan and implement your data analytics projects, and rest assured that you’ll get the best service.
Regards,
Teo Lachev Prologika, LLC | Making Sense of Data Microsoft Partner | Gold Data Analytics
I’m excited to announce the availability of my latest (7th) book – Applied Microsoft Power BI! Currently, this is the only book on Power BI. The book page has more information about the book, including the front matter (with foreword by Jen Underwood), source code, and a sample chapter (Chapter 1 “Introduction to Power BI”). You can order the paper copy on Amazon, and soon on other popular retail channels. I predict that 2016 will be the year of Power BI and I hope that this book will help you to take the most out of it and bring your data to life! And if you’re looking for instructor-led training on Power BI and Microsoft BI, please check our training classes.
Let’s face it. Without supporting data, you are just another person with an opinion. But data is useless if you can’t derive knowledge from it. And this is where Power BI can help you. While writing the book and helping customers use Power BI, I’m astonished by its breath of features and the development momentum Microsoft has put behind it. The Power BI cloud service gets major features every week, while Power BI Desktop is updated every month! Although this makes it hard for people like me who are writing books, it’s a great value proposition for you.
Not to mention that Power BI has the best business model: most of it it’s free! Power BI Desktop and Power BI Mobile are free. Power BI Service is free and has a Power BI Pro subscription option that you could pay for, following a freemium model. Cost was the biggest hindrance of Power BI, and it’s now been turned around completely. You can’t beat free! In this newsletter, I’ll revisit how Power BI can benefit different users in your organization.
Power BI for Business Users
To clarify the term, a business user is someone in your organization who is mostly interested in consuming BI artifacts, such as reports and dashboards. Business users can utilize Power BI to connect to popular cloud services, such as Salesforce, Marketo, Google Analytics, Dynamics CRM, and many more. With a few clicks, a business user can use content packs to connect to cloud data and gain insights from predefined reports and dashboards, and create custom reports. Other cloud-hosted providers build profitable businesses around SaaS cloud BI but Power BI does it for free!
With a few clicks, business users can analyze data from files and cubes without having to create data models. And they can also view Power BI dashboards and reports on mobile devices so they are always informed while they are on the go. Again, all of this for free!
Power BI for Data Analysts
A data analyst or BI analyst is a power user who has the skills and desire to create self-service data models. Leveraging the Microsoft’s prior investment in Power Pivot, Power View, and Power Query, Power BI lets business analysts import data form virtually everywhere and create sophisticated self-service models whose features are on a par with professional models and cubes. And now that we have a native support for many-to-many relationships, there shouldn’t be a requirement you can’t meet with Power BI.
As a data analyst you have a choice about your toolset because you can create models in both Excel or in Power BI Desktop. While other vendors charge hefty licensing fees for desktop modeling tools, Power BI Desktop is free and it gets updates every month! Think of Power BI Desktop as the unification of Power Pivot, Power Query, and Power View. Previously available as Excel add-ins, these tools now blend into a single flow. No more guessing which add-in to use and where to find it! Because many data analysts use R to data analysis and statistics, Power BI recently added support for R scripts and visualizing data using the R plotting capabilities.
Power BI for Pros
BI pros and IT pros have much to gain from Power BI. An IT pro can establish a trustworthy environment that promotes sharing of BI artifacts. To do so, IT can set up Power BI workspaces that allow authorized users to see the same BI content. If IT needs to distribute BI artifacts to a wider audience, such as the entire organization, she can create an organizational content pack and publish it to the Power BI Content Gallery. Then her coworkers can search, discover, and use the content pack. And IT can set up an organizational gateway to centralize and grant access to on-premises data.
The scenario that BI pros will probably be most excited about is hybrid BI solutions, where the report definitions (not data) is hosted in Power BI but corporate data remains in relational databases and cubes. This is a scenario that Prologika is planning for a cloud-averse Fortune 10 company in order to empower their users with mobile reports and dashboards. But that’s not all! BI pros can also implement predictive and real-time solutions that integrate with Power BI, and book has the details.
Power BI for Developers
Power BI has plenty to offer to developers as well because it’s built on an open and extensible architecture that embraces popular protocols and standards, such as REST, JSON, and oAuth. For years, Microsoft didn’t have a good solution for embedding interactive reports in custom apps. Power BI enables this scenario by allowing developers to embed dashboard tiles and interactive reports. Soon it will also support custom authentication.
Microsoft has also published the required “custom visuals” interfaces to allow developers to implement and publish custom visuals using any of the JavaScript-based visualization frameworks, such as D3.js, WebGL, Canvas, or SVG. Do you need visualizations that Power BI doesn’t support to display data more effectively? With some coding wizardry, you can implement your own, such as the Sparkline visual that I published to the Power BI visuals gallery!
In summary, no matter what data visualization or data analytics requirements you have, Power BI should be at the forefront and you ought to evaluate its breath of features. Remember that Power BI is a part of a holistic vision that Microsoft has for delivering cloud and on-premises data analytics. When planning your on-premises BI solutions, consider the Microsoft public reporting roadmap. Keep in mind that you can use both Power BI (cloud-based data analytics) and the SQL Server box product on-premises to implement synergetic solutions that bring your data to life!
As you’d probably agree, the BI landscape is fast-moving and it might be overwhelming. If you need any help with planning and implementing your next-generation BI solution, don’t hesitate to contact me. As a Microsoft Gold Partner and premier BI firm, you can trust us to help you plan and implement your data analytics projects, and rest assured that you’ll get the best service.
Regards,
Teo Lachev
Teo Lachev President and Owner Prologika, LLC | Making Sense of Data Microsoft Partner | Gold Data Analytics
Before we get to the subject of this newsletter, I’m happy to announce the availability of my latest class – Applied Power BI Service. As you’ve probably heard by now, Power BI Service (or Power BI 2.0) is the Microsoft latest cloud-based analytics service with a simple promise: 5 seconds to sign up, 5 minutes to wow! If you’re ready to disrupt how your organization is analyzing data, please contact me to schedule this class at your convenience and get immediate value.
What Not To Do
Back to the newsletter subject, let’s start with a story that was inspired by true events as they say in the movies. Not a long time ago, a man wanted a nice and modern house for his family. He hired a couple of well-known builders but they didn’t deliver what the man really wanted. Then, the man hired a third builder who built him a great house (or a close approximation of the grand vision). Everyone was happy and they lived happily ever after…or at least until the man sold the house to another man.
The second owner had more pressing needs and another vision about the house. Not only the house had to accommodate his family but now the house had to entertain hordes of guests so it had to be expanded. But to cut down cost, the second man decided to maintain the house on his own or outsource whatever he can’t do to a cheap builder. The new owner put hastily new rooms and did other renovations as necessary. Expansion and new construction were his highest priorities and there was never time for proper maintenance or to reinforce the house infrastructure so that it can accommodate the new demands. Needless to say, not much time had passed until the infrastructure gave up. For example, it took days for clogged pipes to drain and guests were not happy. Did I mention the man sold his guests the sun and the moon?
What does this have to do with Extraction, Transformation, and Loading (ETL)? Data is rapidly growing nowadays while ETL processing windows are shrinking. You must do more with less. And, ETL usually becomes a performance bottleneck that stands in the way of your current and future BI initiatives
What To Do
How did the story end? The story didn’t end and it will never end. If you have a house, you can just focus on renovations and additions. You must also maintain it and you must budget for it. One day a member of the man’s family did something out of ordinary and the entire infrastructure collapsed. There wasn’t a way to find out why and the family was scurrying around trying to apply quick fixes. Finally, the second man hired hastily the original builder to assess the situation. Among other things that the builder did to resolve the crisis, he recommended changes and proactive maintenance along the following ten tenets:
Parallelism – The chances are that you have an ETL framework that orchestrates package execution, log errors, etc. And, the chances are that the framework executes packages sequentially. With all the bandwidth modern servers have, there is no excuse if your framework doesn’t support parallel execution. That’s because many ETL tasks, such as ODS loads, loading dimensions and independent fact tables, can benefit greatly from parallel execution. For example, at Prologika we use ETL framework that supports a configurable number of parallelism. Once you configure which packages can run in parallel, the framework distributes the packages across parallel flows.
Incremental extraction – If you have small data volumes, you might get away with fully loading the source data but most systems would require incremental extraction. Again, this is something the ETL framework is best suited to handle.
Volume stats – ETL must log in important data volume metrics, such as number of rows extracted, inserted, updated, and deleted. It should also load how many days were processed since the last incremental extraction and additional context that might be useful for troubleshooting purposes, such as what parameters were passed to stored procedures.
Targeted execution – I recommend you add a target execution duration for each package. Then, ETL will log in the actual duration so that you can detect performance deviations from the norm.
Daily monitoring – I suggest you implement and publish a dashboard, such as using Excel Power Pivot, and monitor this dashboard daily. For example, the dashboard should include a Package Execution KPI that flags excessive executions in red based on the performance metrics you established in step 4.
Regression analysis – Once things “normalize”, create an one-time Extended Events session (assuming SQL Server) to capture the query plans for all significant queries. If during daily monitoring you discover a performance deviation, run the session again focusing on that slow package and compare the query plan with the baseline. Analyze both query plans to find if and why they have changed. To make this easier, when SQL Server 2016 ships, consider upgrading to take advantage of the new Query Store feature.
Cold data archiving – If you lots of source data, e.g. billions of rows, consider archiving historical data that no one cares about, such as by uploading to Azure Table storage.
Project deployment – Consider upgrading to SSIS 2012 or above to benefit from its project deployment so that you can get task-level performance analysis in addition to easier development.
Avoid locking – Use “SET TRANSACTION ISOLATION LEVEL READ UNCOMMITED” at the beginning of your stored procedures of freeform SQL to avoid read locks. I prefer using this statement instead of the NOLOCK hint for its brevity and so that I don’t miss a table.
ELT pattern – I saved the best for last. I’m a big fan of the ELT pattern. I usually try to get out as fast as I can from the SSIS designer. Instead of transformations in the ETL data flow, consider ETL pattern for its performance and maintenance benefits. For more information about the ELT pattern, read my blog “3 Techniques to Save BI Implementation Effort.
As you’d probably agree the BI landscape is fast-moving and it might be overwhelming. As a Microsoft Gold Partner and premier BI firm, you can trust us to help you plan and implement your data analytics projects.
Regards,
Teo Lachev
Teo Lachev President and Owner Prologika, LLC | Making Sense of Data Microsoft Partner | Gold Data Analytics
EVENTS & RESOURCES
Prologika: Applied Power BI Service training by Prologika (online or instructor-led): Atlanta BI Group: Enhancing Data Analysis and Predictive Analytics with NoSQL by Cornell A. Emile on September 28th Atlanta BI Group: ETL Architecture Reusable Design Patterns and Best Practices by Stephen Davis on October 26th
While you might be still trying to convince management to upgrade to Office 2013, the next version of MicrosoftOffice (Office 2016) is on the horizon and scheduled to be released sometime in the Fall. Meanwhile, you can download and test the Public Preview. Naturally, you might wonder what’s new for BI given that Excel is the Microsoft premium BI desktop tool. In this newsletter, I’ll share my favorite Excel 2016 BI features (most significant listed first).
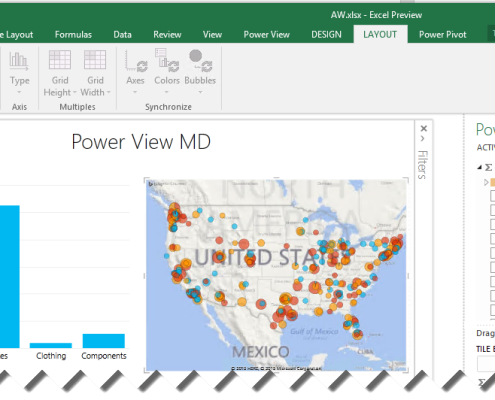
Power View Connectivity to Multidimensional Cubes
I don’t know why it took more than two years for Microsoft to add this feature (initially released for Power View in SharePoint), but you will be finally able to use Power View in Excel 2016 to connect to OLAP cubes, just like we can use Power View in SharePoint as a front end to cubes. What this means to you is that you can preserve your OLAP investment by allowing business users to use Power View to build dashboardsand perform ad-hoc data analytics.
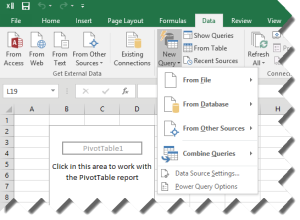
Native Power Query Integration
If you follow the Power Query story, you know that it has an increasingly popular place in the Microsoft BI strategy. In fact, all data roads in Power BI 2.0 go through Power Query because of its integration with Power BI Designer. Besides not having to go through extra steps to download and install Power Query, the native integration allows you to manipulate programmatically Power Query objects using VBA, C#, or PowerShell code and record macros, as explained in more details in this document.
Continuing down the integration path, you can now easily enable all “Power” features from File > Options > Advanced > Turn on data analysis features. In the past you had to enable add-in separately using File- >Options >Add-Ins > Manage “Com Add-ins” > Go.
Power Pivot Improvements
As you probably know, your business users can use Power Pivot to build sophisticated self-service BI models that are on a par with organizational models. Moving forward to Office 2016, the Power Pivot models will support many-to-many relationships. Unfortunately, this feature didn’t make it to the Office 2016 public preview but when released it should work in the same way as in the Power BI Designer. Continuing further down the list, you can now rename tables, columns and calculated fields/measures in the Power Pivot add-in and they will automatically propagate to Excel and existing reports. In another words, metadata changes are not breaking changes to existing reports anymore.
And it gets easier to define relationships. When you are building a Data Model PivotTable working with two or more tables with no relationships defined, you get a notification to run Automatic relationship detection. This will detect and create all relationships between the tables that are used for the Data Model PivotTable so that you don’t have to do any of the work yourself. DAX added many new functions which are documented here.
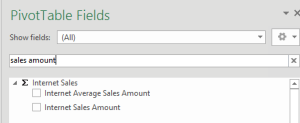
Usability Improvements
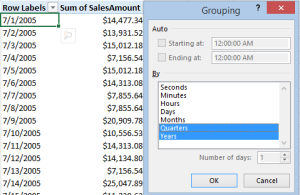
Another long anticipated feature made the cut. The Excel Field List added a Search feature to allow the end user to filter names of tables, columns, and measures. This works across all data structures: Power Pivot, Tabular, and Multidimensional. Similar to native pivot tables, pivot reports connected to Power Pivot models now support Time grouping. For example, this feature allows the end user to group a report at a day level to any time interval, e.g. year and then quarter.
Similar to native pivot tables, pivot reports connected to Power Pivot models now support Time grouping. For example, this feature allows the end user to group a report at a day level to any time interval, e.g. year and then quarter.
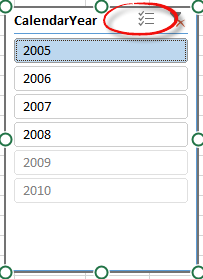
Excel regular slicers now add a multi-select option so that the user doesn’t need to remember to hold down the Ctrl key to select multiple items.
Forecasting Functions
Recognizing the need for time series forecasting, Excel adds forecasting functions, which are documented here. For example, the Forecast.ETS function predicts a future value based on existing (historical) values by using the AAA version of the Exponential Smoothing (ETS) algorithm. In the example below, Forecast.ETS calculates the forecasted value for the date in cell O16, using the historical values in the range P5:P15 across the dates in the time series from the range O5:O15).
=FORECAST.ETS(O16, P5:P15, O5:O15) The function also supports arguments also for confidence interval and seasonlity.
As you’d agree, the BI landscape is fast-moving and it might be overwhelming. As a Microsoft Gold Partner and premier BI firm, you can trust us to help you plan and implement your data analytics projects.
Regards,
Teo Lachev
Teo Lachev President and Owner Prologika, LLC | Making Sense of Data Microsoft Partner | Gold Data Analytics
EVENTS & RESOURCES
Atlanta BI Group: Microsoft and Revolution Analytics: What’s the Add-Value? by Dr. Mark Tabladillo on June 29th Atlanta BI Group: Sentiment Analysis with Big Data & Machine Learning by Paco Gonzalez on August 31th
A while back I met with a client that was considering overhauling their BI. They asked me if the traditional data warehousing still makes sense or should they consider a logical data warehouse, Big Data, or some other “modern variant”. This newsletter discusses where data warehousing is going and explains how different data architectures complement instead of compete with each other.
QUO VADIS DATA WAREHOUSE?
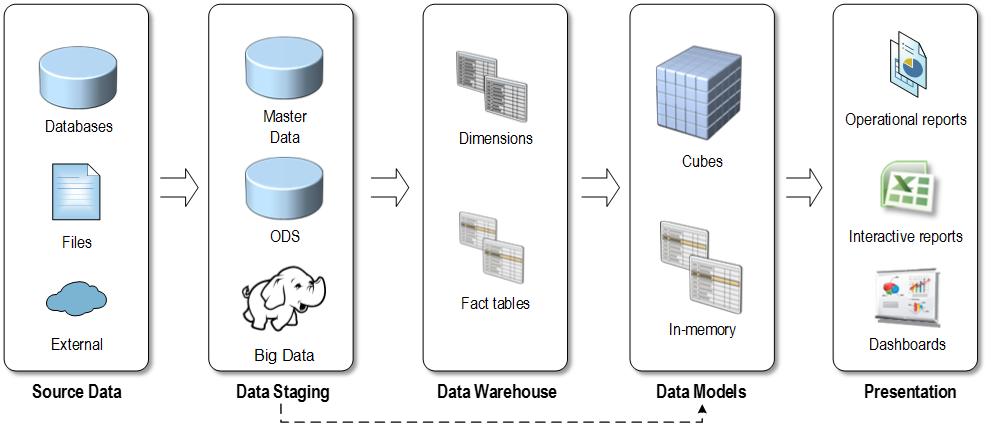
The following diagram illustrates the “classic” BI architecture consisting of source data, data staging, data warehouse, data model, and presentation layers (click to enlarge the image).
Yes, not only is the data warehouse not obsolete, but it plays a central role in this architectural stack. Almost always data needs to be imported, cleansed and transformed before it can be analyzed. The ETL effort typically takes 60-80% percent of BI implementation effort. And, currently there isn’t a better way to store the transformed data than to have a central data repository, typically referred to as a “data warehouse”.
That’s because a data warehouse database is specifically designed for analytics. Ideally, most or even all of dimensional data should be centrally managed by business users (data stewards) outside the data warehouse. However, the unfortunate truth is that not many companies invest in master data management. Instead, they kick the data quality can down the road and pay much higher data quality later but this is a topic for another newsletter. A well-thought architecture should also include a data model (semantic) layer, whose purpose and advantages I’ve outlined in my “Why Semantic Layer?” newsletter.
BIG DATA
Irrespective of the huge vendor propaganda surrounding Big Data, based on my experience most of you still tackle much smaller datasets (usually in the range of millions or billions at worst). This is not Big Data since a single (SMP) database server can accommodate such datasets. This is a good news for you because Big Data typically equates big headaches. For those of you who truly have Big Data, its implementation should complement, instead of replace, your data warehouse. Even though the advancements in the popular Big Data technologies are removing or mitigating some of the Big Data concerns, such as slow queries, these technologies are still “write-once, read many”, meaning that they are not designed for ETL and data changes.
Moreover, a core tenant of data warehousing is providing a user-friendly schema that supports ad-hoc reporting and self-service BI requirements. By contrast, BI Data is typically implemented as a “data lake” where data is simply parked without any transformation. For more information about Big Data and how it can fit into your BI architecture, read my Big Data newsletter.
LOGICAL DATA WAREHOUSE
Recently, logical data warehouses (LDW) have gained some traction and backing from vendors, including Composite (acquired by Cisco), Denado, and others. Logical data warehousing is also known as data federation and data virtualization. The idea is simple – consolidate and share the data in a controlled manner to all users and applications across the enterprise. Data is made available as virtual views on top of existing data sources, with additional features, such as discovery and caching. Again, the goal here is not to replace the traditional data warehouse, but make its data, plus the data from other systems, readily available for self-service BI and/or custom applications.
Logical data warehousing is at a very early stage of adoption. In my opinion, the companies that will benefit most of it are large organizations with many data repositories, where data availability is a major barrier for enabling self-service BI. If you believe that your organization might benefit from a Logical Data Warehouse, you might not need to make a major investment. If your organization has an Office 365 Power BI subscription, your first step could be leveraging the Power Query capabilities for dataset sharing and discovery. This process can work like this:
Designated users promote virtual views in the form of Power Query queries to Office 365.
A data steward verifies and approves these datasets.
Once signed in to Office 365, other users can search, preview these queries, and import the associated data in self-service BI models.
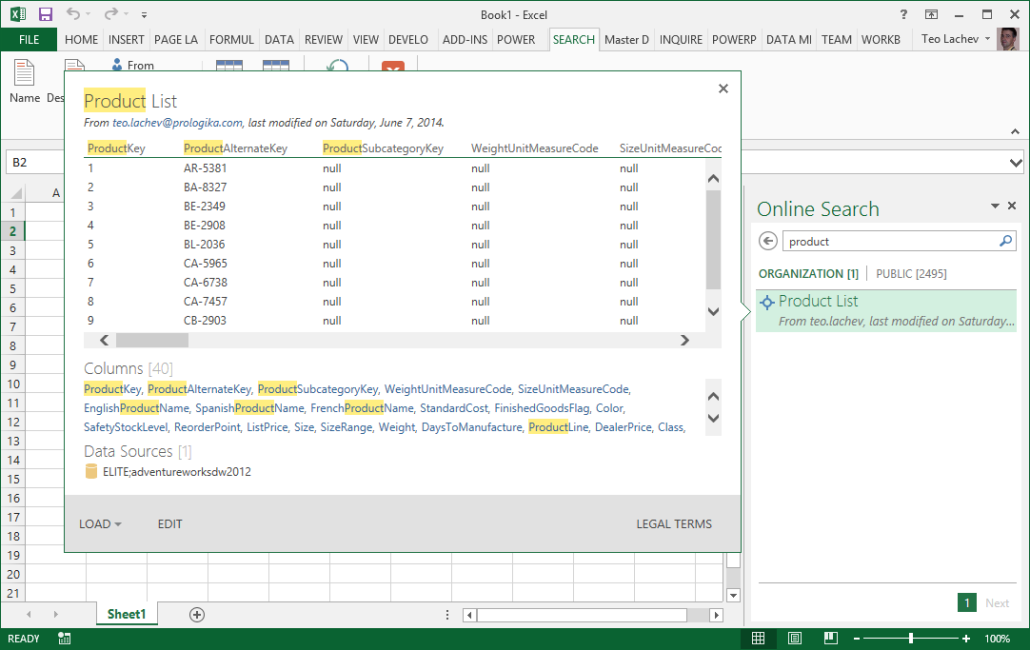
The following snapshot shows how a business user can search and preview a published query that returns Product List data.
One caveat is that these shared queries are currently Power Query-specific and they can only consumed by Microsoft self-service BI tools, which currently include Excel and Power BI Designer. I recommended to Microsoft to expose shared queries as ODATA feeds to enable additional integration scenarios.
SELF-SERVICE BI
Self-service BI allows power users to create their own data models by using specialized tools, such as Power Pivot, Tableau, QlikView, and so on. Despite what some “pure” self-service BI vendors proclaim, self-service BI is not a replacement for data warehousing. In fact, a data warehouse is often a prerequisite and a major enabler for self-service BI. That’s because a data warehouse provides consumers with clean and trusted data that can be further enriched with external data
As you’d agree, the BI landscape is fast-moving and it might be overwhelming. As a Microsoft Gold Partner and premier BI firm, you can trust us to help you plan and implement your data analytics projects.
Regards,
Teo Lachev
Teo Lachev President and Owner Prologika, LLC | Making Sense of Data Microsoft Partner | Gold Data Analytics
EVENTS & RESOURCES
PASS Data Analytics Conference, April 20-22, Santa Clara, California Atlanta BI Group: Overview of R by Neal Waterstreet on March 30th Friendlier Data Profiling with the SSIS Data Profiler Task by Julie Smith on April 27th SQL Saturday Atlanta on May 16th


 I’m excited to announce the availability of my latest (7th) book –
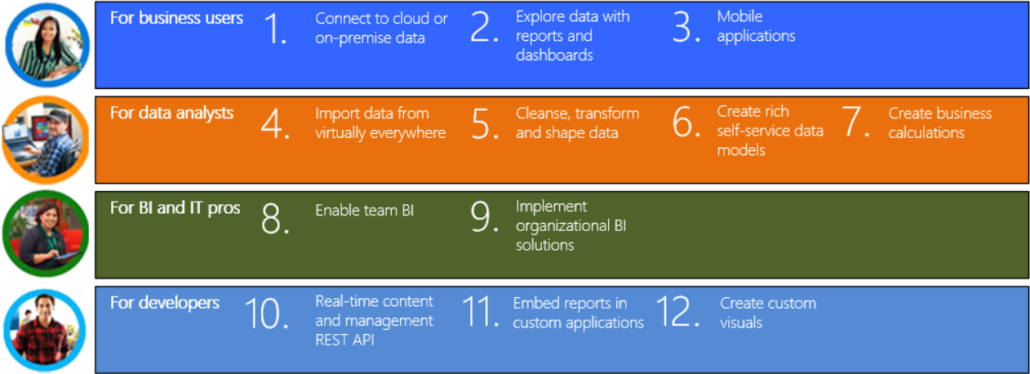
 Prologika: “
 Before we get to the subject of this newsletter, I’m happy to announce the availability of my latest class –
 A while back I met with a client that was considering overhauling their BI. They asked me if the traditional data warehousing still makes sense or should they consider a logical data warehouse, Big Data, or some other “modern variant”. This newsletter discusses where data warehousing is going and explains how different data architectures complement instead of compete with each other.