I’m excited to announce the second Prologika Power BI Showcase – Supply Chain that was added to the Power BI Partner portal! It’s based on the work we did for the world’s largest package delivery company and a provider of supply chain management solutions. Prologika designed a Power BI-based solution for a Fortune 50 organization to consolidate data sources and customer service reports and make them available on mobile devices.
Problem
This large organization wanted to strengthen its value and growth by redesigning current processes, improving business flexibility, time-to-market, innovation, and customer experience. Customer Service managers had to print or bring people into their office to review operational statistics with their representatives and team. This was taking additional management time to create the reports and then time to pull the representatives off the floor. Management needed a mobile solution for reviewing customer representative and team operational statistics. At the same time, security and service requirements dictated that the company’s data must remain on premises.
Solution
Prologika implemented a Power BI hybrid solution. The data was loaded in Analysis Services semantic models. The solution used the Power BI Enterprise Gateway to provide connectivity to the on-premises data. Managers use the Power BI mobile apps to view insightful Power BI reports and dashboards on tablets and smart phones.
Value to Customer
Power BI allows Customer Service managers to view key performance statistics on any device and from any place that has Internet connectivity. The hybrid solution didn’t require any changes to the current infrastructure, such as opening ports or granting proxy exceptions. Moreover, it brought the agility of the cloud and started a path of transformation for data analytics. Other organizational units are currently adopting the Power BI hybrid architecture developed by Prologika.
Visit the solution page to learn more about how we did it, watch a short video, and even try the interactive reports! Have questions? Contact me to today to find how Power BI can change your business!
https://prologika.com/wp-content/uploads/2016/01/logo.png00Prologika - Teo Lachevhttps://prologika.com/wp-content/uploads/2016/01/logo.pngPrologika - Teo Lachev2016-04-27 21:12:262016-05-01 12:05:27Prologika Power BI Showcase – Supply Chain
MS BI fans, join me for the next Atlanta MS BI Group meeting on Apr 25th and 6:30 PM. Paco Gonzalez will present the Azure Internet of Things(IoT) and I’ll show you Power BI Embedded Azure cloud service. SolidQ will sponsor the event. Don’t forget to RSVP at atlantabi.sqlpass.org so we can’t an accurate headcount.
The Internet of Things (IoT) is the network of physical objects—devices, vehicles, buildings and other items—embedded with electronics, software, sensors, and network connectivity that enables these objects to collect and exchange data. The Azure Internet of Things (IoT) Suite brings the Internet of your things to life. Connect your devices, analyze previously-untapped data, integrate business systems to transform your company when you uncover new business models and revenue streams. Join this session for a quick introduction and group discussion.
Speaker:
Paco Gonzalez is a Microsoft Data Platform MVP and SolidQ Mentor, is the PASS Big Data Virtual Chapter Leader, SQL Saturday Barcelona Organizer. He is finishing his PhD thesis about: “Analyzing Social Data with Machine Learning.” He is an MCT and MCP on BizTalk Server and SQL Server. He is coauthor of Microsoft Training Kit 441. Paco is a frequent speaker at large and small conferences. SQL Saturdays, TechEds, PASS BA, PASS Summit, DevWeek London, and PAW Chicago and London.
Sponsor:
SolidQ delivers services for Microsoft platforms that help you architect, integrate and optimize your use of data. The result? Our clients think bigger and move faster because we help them build the capacity and skills to interact with data in creative, collaborative ways that deliver new insights to the business. At SolidQ we measure our success by your satisfaction – and we guarantee it.
Prototypes with pizza
Power BI Embedded with Teo Lachev Take a glimpse of how you can embed Power BI content in custom apps
https://prologika.com/wp-content/uploads/2016/01/logo.png00Prologika - Teo Lachevhttps://prologika.com/wp-content/uploads/2016/01/logo.pngPrologika - Teo Lachev2016-04-21 07:49:462016-04-21 07:49:46Atlanta MS BI Group Meeting on Apr 25th
I while back I did a TechEd presentation “Can Your BI Solution Scale?”, when I discussed a methodology for load testing SSAS and SSRS. A customer wanted to ensure that its Tabular model can scale to thousands of deployed users when it goes live.
You can still use the excellent Microsoft-originated AS Load Sim framework that I demonstrated in the presentation to load test Tabular. And you can use it can send both MDX and DAX queries.
One aspect that deserves more attention is how to tweak the framework to parameterize DAX queries. The framework was design to parameterize MDX queries with tupples. For example, if you want to parameterize an MDX query by month, you can specify the set NonEmpty( [Date].[Calendar].[Month].Members, [Measures].[Internet Sales Amount] ). Then, the framework executes the set and assigns tupples from the set in random so you don’t just get cached results from the same query.
However, you need to make a small change to the framework to parameterize DAX queries. Because DAX queries doesn’t support the MDX UniqueName syntax for filtering, you can’t parse the UniqueName of the tupple member to extract only the name. Instead, you can use the DAX MID function for this purpose. For example, if I want to filter the Customer[Customer Name] column on the actual name, e.g. Acme, you can use the following expression:
Basically, this expression extracts the string “Acme” from ([Customer].[Customer Name].&[Acme]). Since, the customer names will vary. it’s a generic and a rather convoluted expression to extract a string surrounded by “&[” and “])”.
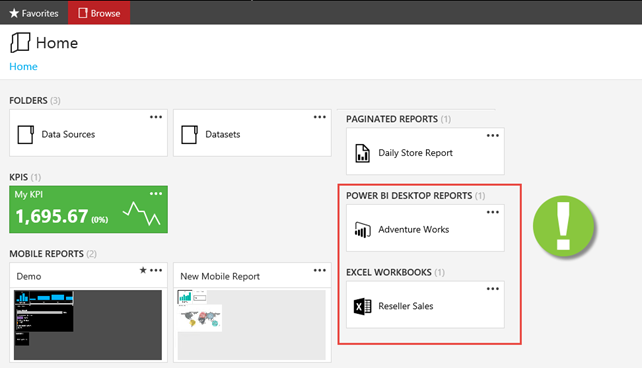
SQL Server 2016 RC3 (last and feature complete RC) just came out for public review. It includes a couple of interesting UX enhancements. The first one is more of a teaser but shows you that Microsoft is committed to fulfill and go beyond its reporting roadmap. SSRS in native mode plays a central role in this roadmap as the on-premises BI reporting platform.
The new portal (the old Report Manager portal is gone BTW) now includes sections if you upload Power BI Desktop files and even Excel workbooks! For SQL Server 2016 RTM timeframe, clicking a file of these two types simply opens it on the client with the corresponding application (Power BI Desktop for PBIX files and Excel for Excel workbooks). So, no embedded web rendering yet but I guess these features won’t be there if Microsoft isn’t prepared to travel the full distance after RTM.
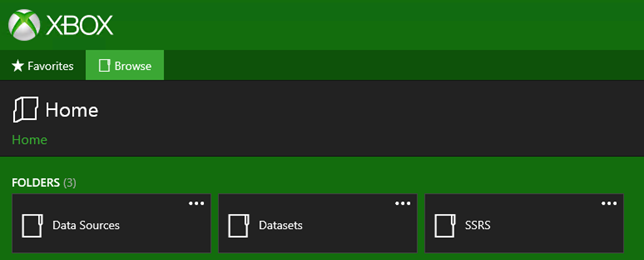
Second, we now have branding of the portal and mobile reports, as Chris Finlan explains in his “How to create a custom brand package for Reporting Services with SQL Server 2016” blog.
https://prologika.com/wp-content/uploads/2016/01/logo.png00Prologika - Teo Lachevhttps://prologika.com/wp-content/uploads/2016/01/logo.pngPrologika - Teo Lachev2016-04-16 18:32:052016-04-16 18:32:05SSRS UX Changes in SQL Server 2016
As Power BI gains a momentum, expect attacks from vendors to intensify. Do you know that there are thousands of vendors offering BI tools! There is not a month passed by when I’m not asked about some cool vendor. I usually don’t criticize other vendors but sometimes I get provoked by their audacity and I need to keep ’em honest. Recently, a customer shared a Sisense whitepaper “Why Business Like Yours Choose Sisense over Power BI” and asked about my thoughts. The whitepaper is not published yet but I guess it will be soon as Sisense has deployed another battle card “Why Business Like Yours Choose Sisense over QlikView” that’s already in the open. Overall, Sisense appears to be a just another pure self-service BI player that it’s trying to aggressively get noticed and refuses to see further then its nose. Judging by their mantra on YouTube and elsewhere, data warehousing is dead, OLAP is dead, star schema is dead, as well as pretty much everything else except Sisense. In their own words:
“DO I NEED TO BUILD A DATA WAREHOUSE?” Absolutely not! Data warehouses are one of the most notorious projects associated with BI tools. That’s exactly what we have vowed to eliminate. We use an in-memory columnar database that automatically connects to your data and builds everything for you. You do not need to worry about a complex data modeling or performance. You just say which data you want to add, and Sisense does the rest.
Dream come true? Actually, nothing new here despite their Don Quixote’s rhetoric. If your BI solution can be done just by joining a bunch of tables, you can do it with any self-service BI tool, as folks have done for many years using Excel, Access, and for the past decade other self-service BI oriented tools. A tool that allows you to just import more data doesn’t solve the inherent problems of self-service BI. Complex data transformation, automation, and consolidation requires a centralized repository. When done right and if you need it, implementing DW shouldn’t be risky, and it should yield a nice ROI together with a true single version of truth. As I said many times, any vendor or a consulting firm that forces you in a particular methodology (pure self-service BI in this case), is just trying to score points and it shouldn’t be taken seriously. There isn’t one-size-fits-all tool or methodology when it comes to data analytics.
Let’s take a look at some of the statements that Sisense makes about Power BI and Sisense offerings. I actually installed their 15-day trial and did some limited testing. Mind you that their whitepaper is limited to comparing the self-service aspect of Power BI with Sisense because they don’t have organizational BI solution (which of course they hold in disdain). So, we’re comparing just Power BI Desktop self-service models and PowerBI Service with Sisense ElastiCube and dashboards. Let’s review some of the claims Sisense makes:
“Power BI is a good out the box tool for simple data analysis, but if you need to analyze larger and more complex data you will likely need to invest in a costly high performance data store. Why? Because of the MS data and technology limitations to query larger or complex data sets, Power BI requires a direct query to the data. If you want the query to run fast or to scale, their lack of a high performance data engine creates 3 issues:
You need expensive technical skills to get the data properly prepared for analysis in the data store.
If you do not have a powerful data store, you need to invest in it.
Business will be more reliant on IT to prepare data, which will create more, not less overhead and longer time to value.”
Sisense is exalting the virtues of ElastiCube as superior to xVelocity (the memory engine behind Power BI Desktop/Power Pivot, Tabular and SQL Server columnstore indexes). SiSense ElastiCube is a proprietary multidimensional storage that is only accessible by Sisense dashboards. Think of ElastiCube as SSAS Tabular but simplified to target business users. Of course, simplification comes at expense of features. However, its storage is disk first, memory second, and it brings data in memory on demand (so think of it as a hybrid between Multidimensional and Tabular). Sisense claims that this architecture is highly scalable and superior to both OLAP and in-memory columnar databases. However, similar to the SSAS default cached storage, ElastiCube requires that all the data must be imported first. I don’t see a pass-through configuration where ElastiCube can pass queries to a fast database. Direct Query, of course, is mentioned as a limitation of Power BI while it should be the other way around. As far as scaling without a backend data store that is sanctioned by IT, I kept on asking myself “How many business users out there have access to billions of rows?” (that need to be imported, mind you!). To Sisense’s point, it’s true that PowerBI.com now limits the datasets you upload to 250 MB (expect this limitation to be lifted) but this 250 MB still allows you to pack a few million rows because data is highly compressed. Anyway, if your business users need to import billions of rows without IT getting involved and data doesn’t require extensive transformations, then Sisense might be worth a try but you probably shouldn’t be on the self-service bandwagon with these data volumes to start with. As far as complex data, I found Sisense to be no match to xVelocity and DAX as you’ll quickly find out when you start modeling with Sisense ElastiCube Manager and look at the limited calculations and relationship options the tool supports. UPDATE 5/16/2016 – Microsoft increased the max file size to 1 GB; UPDATE 7/115/2017 – Power BI Premium has further increased the dataset size to 10 GB.
Dashboard filtering in Power BI – “Limited access pre-defined by dashboard creator using ‘slicer’ widgets”. Power BI supports visual-level, page-level, and report-level filters which Sisense obviously missed. Power BI support basic and advanced filtering modes. Interestingly, when I played with Sisense, their filtering options filters data before it’s aggregated.
Widget drilldown in Power BI – “Only supported in Power BI Desktop, pre-defined by dashboard creator”. Another wrong statement. Users can create ad-hoc reports and they have the same reporting capabilities as in Power BI Desktop.
“To avoid direct queries against data, Power BI Desktop uses a Memory intensive data engine with some data compression – this has all the disadvantages of the in-memory approach relating to performance limitations (you can’t get large data sets into memory) and cost to scale (memory is expensive).” – This goes back to the first point. I’m yet to see business users who are given rights and authority to analyze billions of rows, not to mention the performance implication of importing such a enormous dataset (the only option supported by ElastiCube). And, Power BI compresses everything so the statement “some data compression” is technically inaccurate.
“Applying changes to an existing data model, for example adding or editing a column is like starting from scratch as the model will have to do all the data import and transformations again – very time consuming” – Nope. The Power BI engine is smart enough to apply the minimum processing. If you add a column, it will reload only that table. Not sure what Sisense means by “editing”, since the data is read-only but renaming the column is only a metadata operation and it’s very quick.
“The Query Editor has a wizard feel, but it somewhat complex and clunky” – What’s the Sisense alternative that is not complex and clunky for data transformations by business users? Power Query resonates very well with business users and I don’t agree with this statement but beauty is the eye of the beholder.
“In practice, if analytics are to be done on a larger, more complex data set, much care must be taken to pre-aggregate and clean the data to fit into the data size limitations.” – I don’t see how Sisense would address more complex data. More complex data would probably require an organizational BI solution which they don’t support.
“However as data complexity and requirements generally grow as users’ appetites for more analytics and intelligent dashboards, problems will quickly arise due to the strict data limitations of Power BI.” Would you want your business users to manage complex solutions? Are they actually capable of doing so? If they are, Microsoft gives you a nice continuum where you can move the solution to a dedicated server. True, the modeler needs to learn a few more tricks and get out of Power BI Desktop/Excel and into Visual Studio, and gain many more features than Sisense provides.
“Sisense can deploy to a cloud hosted service, or to an on premise server, while Power BI currently only offers a cloud hosted solution for sharing.” From here, we learn that Sisense Cloud is actually VM-hosted. So, no PaaS. You still have to configure it, manage it, license it, etc.
“You will lose the ability to perform analytics on larger data sets, and will need to make decisions to pre-aggregate data in a data warehouse, or drop portions of the dataset in order to adhere to the data size limits.” We typically don’t pre-aggregate data as we have efficient backend technologies to aggregate it for us.
“In Sisense, you will have a much more flexible, scalable solution that can be maintained much more easily by less technical resources.” – This goes back into the self-service mantra. Large, complex, and scalable solutions are often needed and it’s too much to ask of business users to tackle them.
Of course, Sisense leaves out many other points and features Power BI excels. Q&A? Quick Insights? Excel integration? Security? Governance? Sharing? Speed of development? Real-time BI? Machine Learning? Pricing – for this, you need to call Sisense.
In summary, why Business Like Yours Choose Power BI Over Sisense? Because Sisense is two quadrants behind (it made the Magic Quadrant this year). Read the latest Gartner report to find what Gartner thinks about Sisense (tip: you can download the report from the Sisense site).
https://prologika.com/wp-content/uploads/2016/01/logo.png00Prologika - Teo Lachevhttps://prologika.com/wp-content/uploads/2016/01/logo.pngPrologika - Teo Lachev2016-04-13 14:22:442018-02-15 13:55:12Why Business Like Yours Choose Power BI Over Sisense
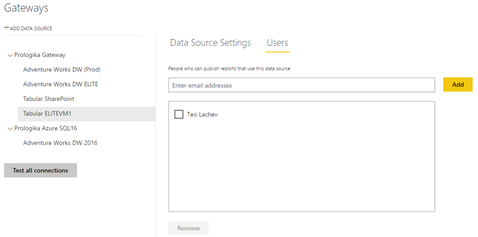
As I explained in a previous blog, the Power BI Enterprise Gateway allows Power BI reports to connect to on-premise data source. A gateway can support multiple data sources. When setting up a data source, you’ll see the Users tab on the data source properties. The users you add here will have rights to publish reports that can connect to a data source serviced by the gateway. This is another security check that Microsoft implemented to limit the number of people who can expose data via the gateway.
If a user is not in the Users tab, the user can publish a Power BI Desktop file to My Workspace (or to another Power BI workspace if it has rights) but the user won’t be able to view reports that connect to a gateway data source. When the user attempts to do so, Power BI will show an error that it can’t connect to the gateway but unfortunately it won’t tell you why. Another gotcha is that even though you might be an admin on the gateway, you won’t be able to view reports you publish unless you are added to the Users tab. I think Power BI just adds the original gateway admin but it doesn’t add users that are subsequently added as gateway administrators.
So, if you face obscure gateway connectivity errors, check the Users tab. In the screenshot below, only I have rights to publish reports that will connect to the gateway.
Question: How do I specify which gateway to use when I create a Power BI Desktop model.
Answer: You never specify a gateway that the report will use. You connect to the data source as you normally would, e.g. you specify the SSAS instance name as you would when connecting to it in Excel. Once you publish the Power BI Desktop file to powerbi.com and a user views the report, Power BI figures which gateway to use. So, gateways are transparent to both report author and viewer. This is good because gateways can be removed or multiple gateways can service the same data source to make it highly available.
https://prologika.com/wp-content/uploads/2016/01/logo.png00Prologika - Teo Lachevhttps://prologika.com/wp-content/uploads/2016/01/logo.pngPrologika - Teo Lachev2016-04-08 15:05:232016-04-08 15:06:21Granting Publishing Rights to Power BI Enterprise Gateway
Embedding reports is an extremely popular scenario for ISVs and developers coding external (customer-facing) applications. As I wrote a while back in my “Power BI Embedded Dashboards Without Authentication UI” blog, Power BI supports REST APIs that allow developers to embed dashboards and reports. However, these APIs don’t support custom security so you have to provision users with Power BI. Furthermore, a hybrid architecture (reports definitions in the cloud and data on premises) requires Power BI Pro license for each user. This pricing model could quickly become overly expensive if you have to onboard hundreds of users.
Power BI Embedded, available for preview on April 1st, aims to remove these obstacles. Designed as an Azure service, it doesn’t require changes to the application security. For example, if your application uses Forms Authentication, users can still continue logging in using a user name and password. The application then calls the Azure APIs to obtain an authorization token that is passed onto Power BI. Once the user is authenticated, the app uses the Power BI REST APIs to embed Power BI content. The other benefit from the Azure integration that the application developer no longer have to work with OAuth API to handle security, as explained in more details here. Power BI Embedded also introduces a new licensing model, where you’re priced per the number of dashboard and reports views that your users render instead of by user. Notice that the licensing terms state that “you may use the Power BI Embedded service within an application you develop only if your application (1) adds primary and significant functionality to our [Power BI] service and is not primarily a substitute for any Power BI service, and (2) is provided solely for external users. You may not use the Power BI Embedded service within internal business applications”.
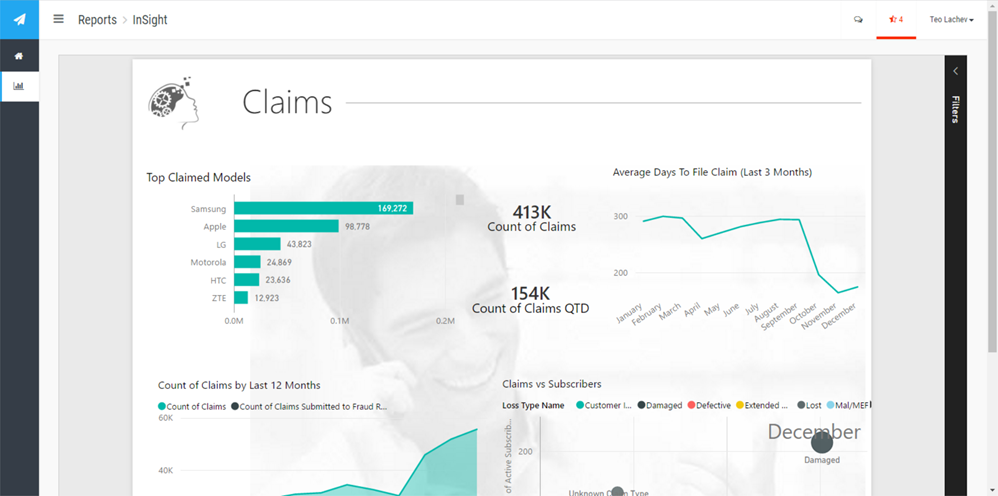
On the downside, the preview doesn’t support refreshing imported Power BI Desktop models. As far as direct connectivity, the preview is currently limited to Microsoft Azure data sources that support basic security (Azure SQL, Azure SQL DW, and HD Insight Spark). So, no support for SSAS yet as SSAS is not available (yet) as PaaS. This limitation also prevents implementing multi-tenant solutions (a must for most ISVs), where the user is authorized to see only a subset of data. Microsoft has provided a sample ASP.NET MVC app and excellent step-by-step documentation to help you get started. Below is a snapshot of the app, which I customized to display embedded custom reports that are demonstrated in the Prologika Power BI showcase.
Power BI Embedded is the missing piece that many ISVs need to integrate interactive Power BI reports and dashboards in their offerings. Although still lacking in features, Power BI Embedded has a bright future.