Tablix – The Crown Jewel
One of most important enhancements coming up in SQL Server 2008 Reporting Services is the new tablix region. In fact, I dare to predict that many folks will upgrade to SSRS 2008 just to get Tablix. What’s tablix anyway?
Tablix = Table + Matrix
So, tablix combines the flexibility of the table region and the crosstab reporting features of the matrix region. Actually, a tablix is table, matrix, and list all in one but I guess the SSRS team decided to keep the name short. Don’t be fooled by the old toolbar buttons because they just provide entry points to the tablix region. If you click the Matrix button, you will get a tablix region preconfigured for crosstab reporting, when you click the Table button you get a table report, and List button will give you a free-form Tablix. So, this is simple. In SSRS 2008, tablix powers all reports.
Why is Tablix so cool? Because it lifts many of the matrix limitations and add features not possible before. Take for example the following report that demonstrates a couple of the new Tablix features.
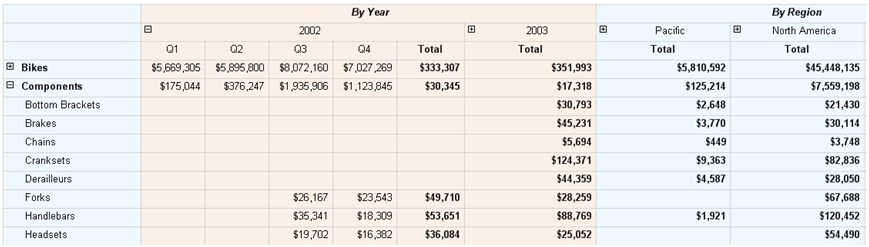
First, Tablix lets you have stepped columns with crosstab reports. For example, Product Category and Product Subcategory share the same column. This may not sound very exciting but it wasn’t that easy to implement with the old matrix region.
Second, Tablix supports side-by-side crosstab sections. For example, the report has by year and by region sections side by side. This wasn’t possible with Matrix.
Finally, the snapshot doesn’t show this but you have independent group aggregates with crosstab reports. This means that moving to SSRS 2008 you can forget about the InScope() function and all limitations associated with it and matrix-based reports. These limitations made me abandon the matrix region in one of my projects and replace it with programmatically-generated “pseudo” crosstab reports that used the table region.
To take Tablix for a spin, use the standalone Report Designer. Or, open an existing SSRS report in the standalone Report Designer. As mentioned in my previous post, the VS.NET Report Designer doesn’t support Tablix in CTP4.
Matrix is dead, long live Tablix!


