Aggregates of Aggregates
Aggregates of aggregates is a new feature in SQL Server R2 Reporting Services. It can be better understood by the sample Aggregates.rdl report ([View:https://prologika.com/CS/cfs-file.ashx/__key/CommunityServer.Blogs.Components.WeblogFiles/blog/2474.aggregates.rdl]). It shows sales grouped by year and quarter. The Year group subtotals use the Sum aggregation function to sum the quarter sales. The report footer total averages the year subtotals.
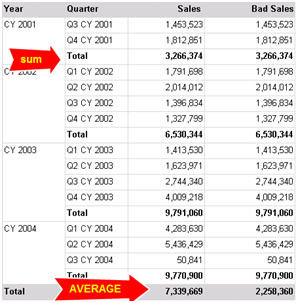
Prior to R2, authoring such a report would require dividing the total sales by the number of quarters, which you can obtain by using the CountRows function. You cannot just use the Avg function in the footer as the Bad Sales measure shows:
=Avg(Fields!Internet_Sales_Amount.Value)
If you do so, the Avg function would operate on the detail rows (all quarter rows) and it would produce 2,258,360. R2 lets you nest aggregate functions. The Sales footer total uses the following expression:
=Avg(Sum(Fields!Internet_Sales_Amount.Value, “Year”))
In this case, the Average function operates over the aggregated year subtotals. Note that not all aggregate functions can be nested. For example, you cannot define an aggregate over the Aggregate, RunningValue and Previous functions.


