Synchronizing Reporting Services Groups
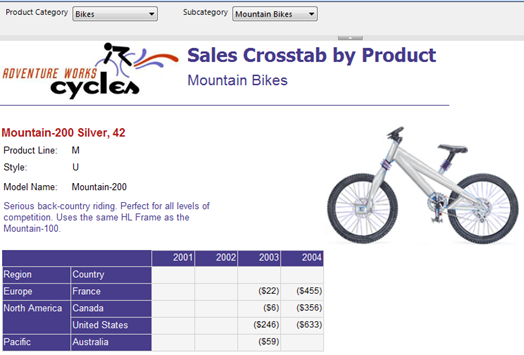
One new R2 feature that I discovered while reading the Reporting Services Recipes book, is group data synchronization. Consider the following report (download the two sample reports here):
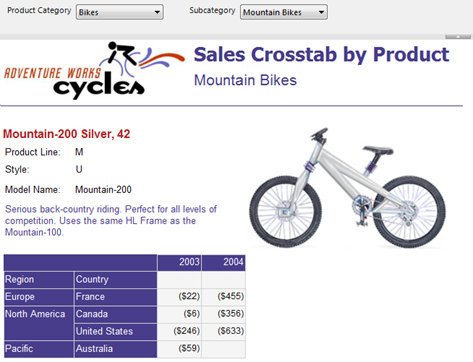
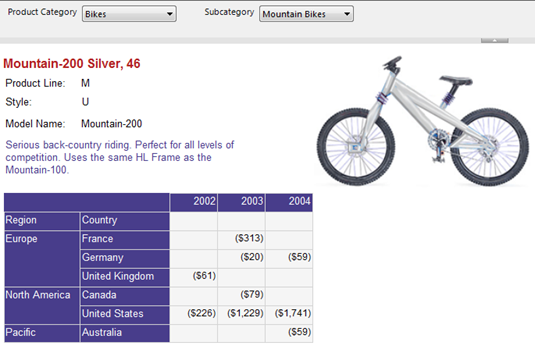
In this report, the matrix region is nested inside a list region. The list region pages (groups) on product while the nested matrx region displays the sales for the current product grouped by region and year. As you can see, Mountain-200 Sliver, 42 has data for years 2003 and 2004 but if you move to the next page, you will see that Montain-200 Silver, 46 has sales for 2002, 2003, and 2004.
What if you want to synchronize the instances of the matrix region to return the same number of columns, which in this case would it all available years in the dataset? In R2, this takes a few clicks.
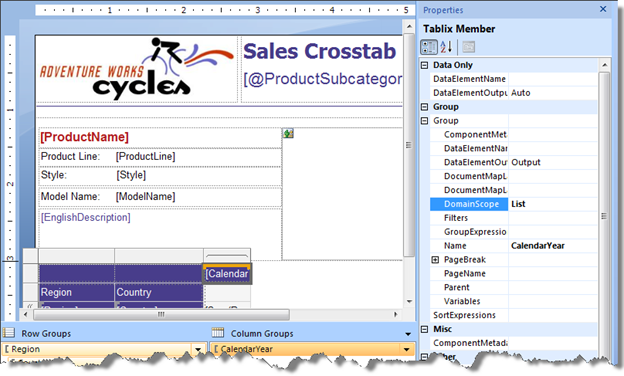
- In design mode, click anywhere inside the nested matrix region so the Groups pane shows its groups.
- Select the CalendarYear column group on which the matrix region pivots.
- Expand the Group section in the Properties window and enter the name of the outer region in the DomainScope property. In this case, the outer region is the list region whose name is List.
Now, when you run the report, all instances of the matrix region are synchronized and have the same number of columns irrespective of the fact that they might not have data for given years.
DomainScope is similar to expression scope but not the same. DomainScope can be set on a group leaf member only. So, if the matrix region was grouping on years and quarters, you can synchronize quarters only in which case each year would show four quarters. You cannot synchronize the Year level because it’s a parent group. In addition, the domain scope can be an outer group or region. Unlike expression scopes, you cannot synchronize on a dataset.
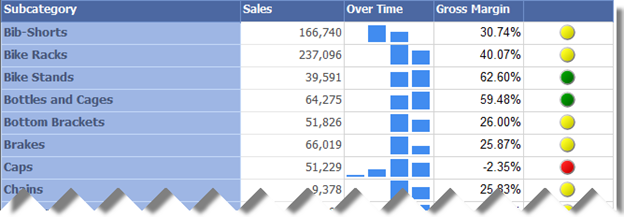
Group synchronization comes also handy when you work with sparklines. For example, the following report includes an Over Time column that shows a bar sparkline for product category sales over years.
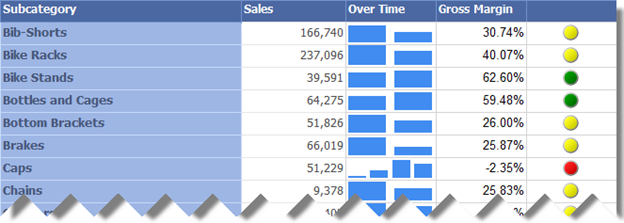
As you can see, the Caps category has sales for four years (The AventureWorksDW2008 database has data for years 2001-2004), while Bib-Shorts category has data for two years. However, the sparklines groups are not aligned. For instance, you can’t tell which two years Bib-Shorts have sales for. To fix this:
- Double-click the sparkline region to show the Chart Data window.
- Click the CalendarYear group and set the DomainScope property to the name of the containing tablix region, Tablix1 in this case.

Now, when you run the report, you’ll see that the sparkline group ordinal position reflects the year. Thus, knowing the range of available years (2001-2004) which for clarity you can display on the report, e.g. as a subtitle, Bib-Shorts have data for years 2002 and 2003, while Bike Racks have data for 2003 and 2004.