PowerPivot Stories from the Trenches
Now that a snow blizzard has paralyzed Atlanta for a week, what a better way to start the new year than sharing a PowerPivot success story. A bank institution has approached Prologika to help them implement a solution to report the customer’s credit history so the bank can evaluate the risk for granting the customer a loan. Their high-level initial requirements call for:
- Flexible searching and filtering to the let the bank user find a particular customer or search for the customer accounts both owned by the bank or externally reported from other banks.
- Flexible report layout that will let the bank user change the report layout by adding or removing fields.
- Ability to download the report locally to allow the bank user to run the report when there is no connectivity.
- Refreshing the credit history on a schedule.
Initially, the bank was gravitating toward a home-grown solution that would require tons of custom code to implement a desktop client that uses a third-party control or ReportViewer for reporting. One cool thing about Microsoft BI and my favorite tip I share at any public event is that reduces or eliminates custom code. This may sound strange coming from someone who spent most of his career writing code but less code is indeed in the customer’s best interest. So, we suggested a solution based on PowerPivot with the following implementation highlights:
- Implement a PowerPiivot application and import the customer and account information.
- Allow the end user to use slicers and PivotTable filters to search and filter data.
- Upload to PowerPivot application to SharePoint to let each bank user view and interact with the report without requiring Excel 2010 installed locally.
- Allow the user to download the application for offline reporting. This requires Excel 2010 with PowerPivot installed locally.
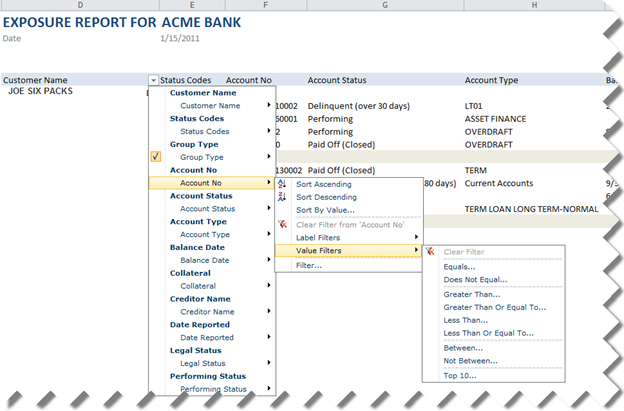
Here is a screenshot of the PowerPivot application rendered in SharePoint (sensitive information replaced to protect the innocent) that demonstrates some of the filtering capabilities that are built in Excel Services:
Needless to say, this PowerPivot-based solution saved our customer a lot of time and money. True, we had to make some tradeoffs in terms of functionality and flexibility. One interesting implementation detail was that the reporting requirements required detail-level reporting at the account level instead of aggregating data. Out initial thought was that the in-memory VertiPaq database could handle this very efficiently. However, we ran into performance issues related to the fact that Excel generates MDX queries against VertiPaq and MDX is not optimized for detailed-level reporting especially when cross-joining multiple dimensions. To mitigate this issue, we took advantage of the Analysis Services Autoexists behavior that cross-joins attributes of the same dimension very efficiently. To do so, we consolidated the Customer and Account information into the Accounts table. We used the Customer table only for the Excel slicers and filtering by customer.
Looking ahead, it will be nice if a future release of PowerPivot detects that it deals with VertiPaq and generates native DAX queries instead of MDX to take a full advantage of VertiPaq. Crescent will be the first and only Microsoft client when SQL 11 ships that will generate native queries so detailed-level reporting will likely to be faster with Crescent.


