What’s New in Office 2013 BI: Part 2 – Power View Enhancements
[View:https://prologika.com/CS/cfs-file.ashx/__key/CommunityServer.Blogs.Components.WeblogFiles/blog/7762.Geography.xlsx:550:0]
Power View in Office 2013 brings the following new features:
- Integration with Excel 2013 – Microsoft has decoupled Power View from SharePoint and included it in Excel so you can create ad-hoc reports connected to BI models, just like you can create pivot reports. I hope the PerformancePoint Decomposition Tree will follow suit.
- New visualizations – This includes interactive and drillable geospatial maps and pie charts.
- Better support of tabular models – Power View now supports key performance indicators (KPIs) and hierarchies.
- Design and branding enhancements – You can now insert images and change the report theme.
To showcase some of these enhancements, I created a personal BI model based on a customer dataset imported from the AdventureWorksDW2012 database (I attached the Excel workbook). To create a Power View report, click on Insert ð Power View button in the Excel ribbon. This creates an empty Power View report connected to the BI model.
My dataset includes the customer location defined as address, postal code, city, state, and country. I’ve found two ways to visualize geospatial data:
-
Use longitude and latitude coordinates – Power View doesn’t support SQL Server geography data types. However, if you have a geography data type, extracting the longitude and latitude values is easy. You just need to query the Lat and Long property of the geography data type.
SELECT SpatialLocation.Lat, SpatialLocation.Long FROM Person.Address
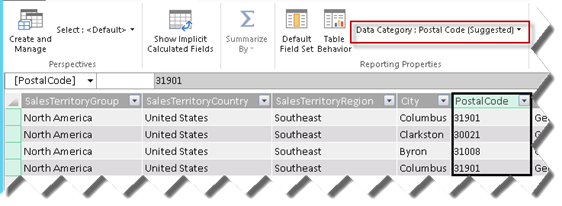
- Geocode from an address. If you drop an address field to the Locations zone, the map will prompt you to geocode it. Power Pivot also supports advanced properties and it tries to infer automatically known field categories. For example, in the screenshot below, Power View has identified that the PostalCode field contains zip codes and mapped it to the Postal Code category.
If you place multiple fields in the Locations zone, Power View will allow you to drill down these fields. In my case, I put the StateProvinceName and PostalCode fields in the Locations zone. Consequently, if I double-click on a bubble, Power View will zoom in the map to show me where my customers are located by postal code within that state. I can click the “drill up” in the map right upper corner to go back to the state level.
Note Not sure if this is a bug with the pre-release version of Office 2013, but Power View seems to have a problem with drilling down to entities with the same name. For example, initially I put the City field in the Locations zone but when I drilled down Georgia, Power View switched to Columbus, Ohio because both Ohio and Georgia have a city Columbus. It appears that Power View drills down to the first entity in finds in that level instead of constraining the list to the parent’s children only.

The Power View report also shows a pie chart. If I click a segment on the pie chart it cross-filters the map. For example, if I click the 2005 pie, the map highlights customers with sales in 2005. Vice versa, if I click a bubble in the map, the pie chart gets updated to show the data for that bubble only, such as sales for customers in Georgia. The field list shows that Power View now supports KPIs and hierarchies. The Gross Sales is defined as a KPI in the underlying model and Customers by Country is defined as a hierarchy. Finally, you can change the report theme and add images from the Excel’s Power View ribbon.


