First Look at Datazen
UPDATE: 1/1/2016 As Microsoft announced in the public BI roadmap (http://blogs.technet.com/b/dataplatforminsider/archive/2015/10/29/microsoft-business-intelligence-our-reporting-roadmap.aspx), Datazen will be fully integrated with SSRS 2016 for delivering mobile reports, alongside paginated (traditional SSRS reports), and Power BI Desktop reports.
To follow up on my blog announcing Datazen, I want to share some additional notes now that I had to chance to install it and take it out for a spin.
Pros
- Easy installation experience – Installation can’t be easier either although I’m not crazy about the Datazen decision to make the Publisher available in the Windows Store. I just don’t like Windows Store applications, not the mention that they don’t work by default with Windows Server (you need to enable the Desktop Experience feature and use a non-admin account). To share your dashboards, you can publish them to a server component (Datazen Enterprise Server). The server installs as an ASP.NET application running under IIS (no surprises here). The server supports custom authentication, where users are stored locally or integrate with Active Directory.
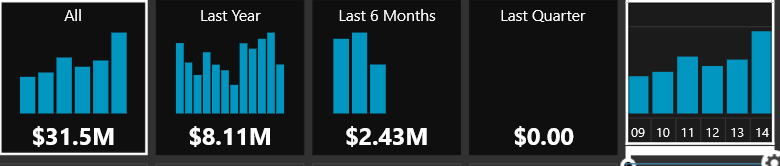
- Easy authoring experience – Designing dashboards with Datazen is a no-brainer. The tool supports the basic visualization blocks, including filters, charts, gauges, three maps, maps (customization with ESRI shapes is possible) and data grids. I’d like the idea to snap visualizations to a grid. When you expand the visualization height or width, the Datazen Publisher realizes that it has more real estate and adds additional elements to the visualization.

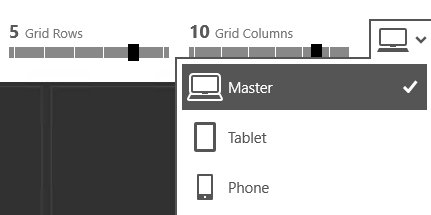
To see how this work, take a look at this video. - Designed for mobile – Everyone wants mobile rendering nowadays but it’s important to agree on what the desired experience should be. Mobile devices range from tablets, which have larger displays, to phones which are much smaller. Responsive web design seems to be compromise but it’s typically limited to reflowing content based on the display capabilities of the device. Rightly so, Datazen allows the designer to optimize the user experience by offering options for Tablet and Phone. The designer doesn’t have to start from scratch when targeting another device. Instead, the designer can use the visualizations already added to the dashboard and just resize and rearrange, or don’t add them at all. The designer supports pre-defined themes. There are native viewer applications for Windows, Windows Phone, iPhone, and Android.
- Good data support – Out of the box, Datazen supports the most common data sources, including Excel files, SQL Server, Analysis Services, Oracle, ODATA, Web Services. Additional data sources can be plugged in via ODBC drivers. The designer can decide to import the data and refresh it periodically or create a connection to the data source and execute live queries. Another feature that I like is that during the design phase the designer auto-generates data so the dashboard can be designed entirely offline. Data can be plugged in later. Live queries can be parameterized. When SSAS is targeted, the user identity can flow to the data model for row-level security using Kerberos or EffectiveUserName. Live queries are configured by implementing server-side views which are conceptually similar to SSRS shared datasets. I didn’t see an option to import SSAS KPIs as PerformancePoint allows you to do.
Cons
- No data exploration – Similar to SSRS, the query is fixed at design time. Therefore, the user cannot change the report layout or add/remove fields. In this age of interactivity, I consider this a major shortcoming. True, the out-of-the-box dashboards are effective and there is more interactivity then SSRS reports, such as the user can slide the finger to select multiple date periods and the page doesn’t repost. Other than that though there is nothing that Datazen can do than SSRS can’t.
- Great front, weak back– It’s obvious that the Datazen developers have focused exclusively on the presentation layer. I didn’t see alerts, subscriptions, printing, exporting, execution log, etc.
- Limited customization – I didn’t see options for expressions, conditional formatting, localization, etc.
- Drillthrough capabilities are limited to initiating a drillthrough on the entire row instead of more granular cell-level drillthrough.
- Confusing integration story – Honestly, I’m not sure why Microsoft acquired this tool and this acquisition is a surprise to me. I’d prefer Power BI v 2.0 on premise with shorter release cycles and more features than yet another visualization tool that has a problem fitting in. I really hope it gets integrated with Power View at some point to reduce confusion.
If your primary visualization goal is implementing basic dashboards that target mobile devices with minimum design effort, Datazen might do the trick. For demos, take a look at demos.datazen.com (use datazen for user name and password).


