Implementing Qlik-style Variables in DAX
A large publicly-traded organization is currently standardizing on Power BI as a single BI platform as a replacement of Qlik and Tableau. They analysts have prepared a gap analysis of Power BI missing features. On the list was QlikSense variables. The idea is simple. The user is presented with a slicer that shows a list of measures. When the user selects a measure, all visualizations on the report dynamically rebind to that measure. For example, if SalesAmount is selected, all visualizations bound to the variable would show SalesAmount. However, if the user selects TaxAmt than this measure will be used.
As it stands, Power BI doesn’t have this feature but with some DAX knowledge, we can get it done by following these simple steps:
- In Power BI Desktop, click Enter Data and create a table called Variable with a single column Measure. Here, I’m hardcoding the selections but they can come from a query of course. Enter the labels of the measures the user will see, such as SalesAmount, TaxAmt, one per row to populate the Measure table.

- Create a new measure that has the following formula. Here I use the SWITCH function to avoid many nested IFs in case of many choices.
SelectedMeasure = SWITCH(TRUE(),
CONTAINS(‘Variable’, [Measure], “SalesAmount”), SUM(ResellerSales[SalesAmount]),
CONTAINS(‘Variable’, [Measure], “TaxAmt”), SUM(ResellerSales[TaxAmt])
)
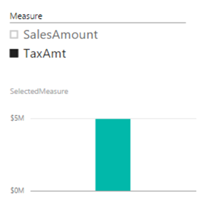
- Add a slicer to you report that shows the Measure column from the Variable table.
- Add visualizations to the report that use the SelectedMeasure measure. Now when you change the slicer, reports rebind to the selected measure.

An interesting progression of this scenario would be to allow the user to select multiple measures and adjust the formulas accordingly, such as to sum all selected measures. Another progression would be to change the list depending on who the user is (Power BI now supports data security!)


