Power BI What-if Analysis
Veteran Excel users might have used the Excel What-if feature that let you try several different sets of values in one or more formulas to explore various outcomes (scenarios). The August release of Power BI Desktop introduces a similar feature. You start by defining a What If parameter from the Modeling tab.
Don’t confuse the What If parameter with a query parameter which is used in query parameter-driven properties, such as to change the data source the query connects to.
In the process of configuring the parameter, you define hardcoded minimum, maximum, and increment values. The outcome is two DAX measures. The first one generates the scale, while the second returns the selected value.
Discount Percentage = GENERATESERIES(0, 0.5, 0.05)
Discount Percentage Value = SELECTEDVALUE(‘Discount Percentage'[Discount Percentage])
Next, you can use the “Value” measure as any DAX measure. Typically, you would create a target measure that somehow depends on the What If parameter, e.g.:
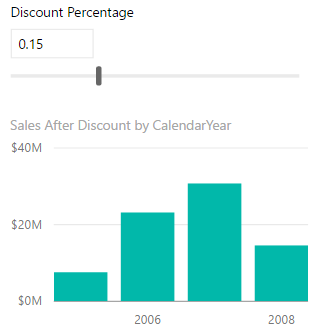
Sales After Discount = SUM([SalesAmount]) – (SUM(InternetSales[SalesAmount]) * ‘Discount Percentage'[Discount Percentage Value])
Now you can see how the target value changes when you change the What If value.
Power BI What If parameters allow you to parameterize you DAX measures. Continuing on the same path, I’d like to see expression-based properties and filters, as well as the ability to parameterize fields on the report, such as to present the user with a list of measures, and rebind visualizations after the user selects which measure they want to see on the report.


