Prologika Newsletter Fall 2013
 I hope you had a great summer. The chances are that your organization has a centralized data repository, such as ODS or a data warehouse, but you might not use it to the fullest. Do you want a single version of truth? Of course, you do. Do you want to empower your business users to create their own reports and offload reporting effort from IT? I bet this is one of your top requirements. A semantic layer could help you achieve these objectives and much more… In this newsletter, I’ll discuss the importance of having a semantic layer that bridges users and data.
WHY SEMANTIC LAYER?
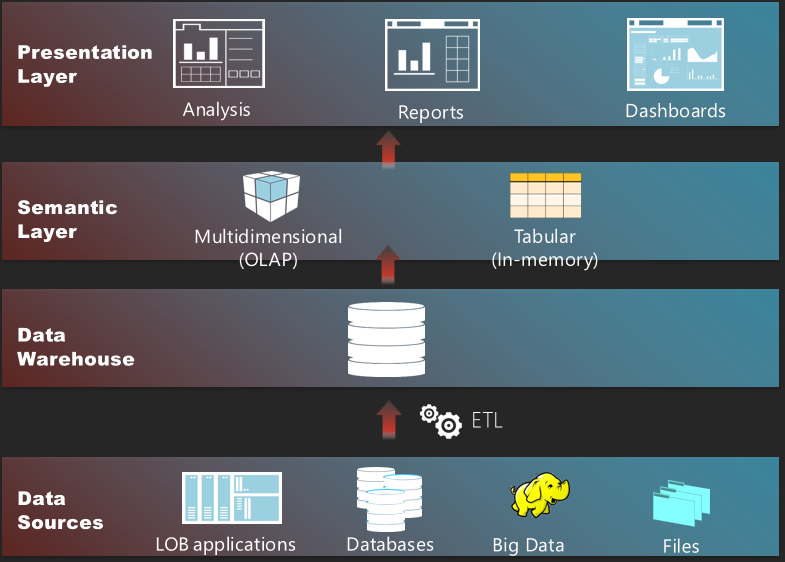
A semantic layer sits between the data and presentation layers. In the world of Microsoft BI, its role is fulfilled by the Business Intelligence Semantic Model (BISM) which encompasses the Multidimensional and Tabular implementation paths. The first chapter (you can download it from the book page) of my latest book “Applied Microsoft SQL Server 2012 Analysis Services (Tabular Modeling)” explains this in more details.
Here are 10 reasons why you should have a semantic layer:
- Abstraction
In general, semantics relates to discovering the meaning of the message behind the words. In the context of data and BI, semantics represents the user’s perspective of data: how the end user views the data to derive knowledge from it. Before we expose data to end users, we need to translate the machine-friendly database structures and terminology into a user-friendly semantic layer that describes the business problems to be solved. To address this need, you create a semantic layer. - Reducing reporting effort
Based on my experience, the typical IT department is caught in a never-ending struggle to create operational reports. A semantic layer is beneficial because it empowers business users to create their own ad hoc reports. For example, one of the nice features of Analysis Services is that the entity relationships become embedded in the model. So, end users don’t have to know how to relate the Product to Sales entities. They just select which fields they want on the report (Excel, Power View) and the model knows how to relate and aggregate data. - Eliminating “spreadmarts”
It seems that all the end users want is Excel data dumps so they can create pivot reports to slice and dice data. In many cases, self-service BI is actually a polished and extended version of the “spreadmart” trend. If this bothers you (and it should), the only way to minimize and eliminate this issue is to have a semantic layer that allows business users to analyze the data from any subject area without having to export the data. Moreover, a semantic layer is a true self-service BI enabler because it allows the users to focus on data analysis instead of data preparation and model creation – skills that many users lack and might struggle with. - Performance
The semantic layer should provide excellent performance when aggregating massive amounts of data. For example, in a real-life project we are able to achieve delivering operational reports within milliseconds that require aggregating a billion rows. Try to do that with relational reporting, especially when you need more involved calculations, such as YTD, QTD, parallel period, etc. - Reducing cost
Do you have biggish data and struggle with report performance? Related to the previous point, having a semantic layer might save you millions of dollars to overcome performance limitations (to a point) by purchasing MPP systems, such as Teradata or Netezza. - Centralizing business logic
The unfortunate reality that we’re facing quite often is that many important business metrics end up being defined and redefined either in complex SQL code or reports. This presents maintenance, implementation, and testing challenges. Instead, you can encapsulate metrics and KPIs where they belong – in your semantic model so they can be reused across reports and dashboards. - Rich client support
Many reporting tools are designed to integrate and support popular semantic models. For example, Microsoft provides Excel on the desktop and the SharePoint-based Power View tool that allows business users to create their own reports. Do you like a specific third-party reporting tool? The chances are that it supports Analysis Services. - Security
How much time do you spend implementing custom security frameworks for authorizing users to access data they are allowed to see on reports? Moving to Analysis Services, you’ll find that the model can apply security on connect. I wrote more about this in my article “Protect UDM with Dimension Data Security”. - Isolation
Because a semantic layer sits on top of the relational database, it could provide a natural separation between reports and data. For example, assuming distributed deployment, a long-running ETL job in the database won’t impact the performance of the reports serviced by Analysis Services. - Additional BI capabilities
A semantic layer can futher enrich your BI solution with appealing features, such as actions, KPIs, and predictive analytics.
HOW DO YOU CHOOSE SEMANTIC LAYER?
Different vendors have different ideology and implementations of semantic layers. Some, such as Oracle and MicroStrategy, implement the semantic layer as a thin, pass-through layer whose main goal is to centralize access to data sources, metadata and business calculations in a single place. For example, a Fortune 100 company that had a major investment in Oracle engaged us to recommend a solution for complementing their OBIEE semantic layer with user-friendly reporting tool that would allow end users to create ad hoc transactional reports from their Oracle Exadata-based enterprise data warehouse. In the OBIEE world, the role of the semantic layer is fulfilled by the Common Enterprise Information Model that encompasses data sources, metrics, calculations, definitions, and hierarchies. When users submit report queries, the Oracle BI Server compiles incoming requests and auto-generates native queries against the data sources plugged in the Common Enterprise Information Model. In theory, this “thin” implementation should work pretty well. In reality, several issues surface:
Performance
Any tool, either a reporting tool or semantic layer, that auto-generates queries should be highly suspect of performance issues. First, no matter how well the tool is designed, it’s unlikely that it would generate efficient queries in all cases. Second, because the tool sends the query to the underlying data source, the overall report performance is determined by how fast the data source crunches data. In this case, the organization was facing performance issues with data aggregation. To circumvent them, their BI developers have implemented summarized fact tables. Once the user reaches the lowest level of the summary fact table, OBIEE would allow the user to drill down to a chained table, such as the actual fact table. Needless to say, business users were complaining that analysis was limited to the dimensionality of the summarized fact table. Further, to avoid severe performance issues with historical reports, the BI developers have taken the “no big aggregations, no problem” approach by forcing a time filter on each request that touches the large fact tables. This effectively precluded historical analysis by year, quarter, etc.
Scalability
When a query involves multiple data source, OBIEE would send a query to each data source, load the data in memory, and then join the datasets together to find matching data. This also presents performance and scalability challenges. To solve performance and scalability issues with “thin” semantic layers and biggish data, organizations ultimately resort to expensive back-end MPP systems, such as Teradata or Netezza, which can parallelize data crunching and compensate for inefficient auto-generated queries. But this is a costly solution!
Common denominator
You’re limited you to a subset of supported features of the underlying data source. Such an architecture ultimately locks you in the data sources supported by the vendor. What happens when there is a new version of the data source that has some cool new features? Well, you need to wait until the vendor officially supports.
The big difference between Microsoft and other vendors in terms of semantic layer implementation is that by default both Multidimensional and Tabular store data on the server. This proprietary storage is designed for fast data crunching even with billions of rows. You pay a price for loading and refreshing the data but you enjoy great query performance with historical and trend reports. And, you get a great ROI because you may not need an expensive MPP appliance or excessive data maintenance. When sent to BISM, queries are served by BISM, and not by the RDBMS. No need for summarized tables and time filters. the new version and its extensions
As you know, the BI landscape is fast-moving and it might be overwhelming. If you have Software Assurance benefits, don’t forget that as a Microsoft Gold Partner and premier BI firm, Prologika can use your SA vouchers and work with you to help you plan and implement your BI initiatives, including:
- Analyze your current environment and determine a vision for a BI solution
- Define a plan to launch a BI reporting and analysis solution
- Upgrading or migrating to SQL Server 2012
Regards,
Teo Lachev
President and Owner
Prologika, LLC | Making Sense of Data
Microsoft Partner | Gold Business Intelligence
EVENTS & RESOURCES
 Atlanta BI Group: Dimensional Modeling 101 by Julie Smith on September 30th presentation
Atlanta BI Group: Head-to-Head on Maps by Dave Tangren on October 28th
SQL Saturday Charlotte: Best Practices for Implementing Enterprise BI Solution presentation by Teo Lachev on October 19th


