Scenario: You have Power View integrated with SharePoint. You attempt to create a Power View report that connects to a SQL Server 2014 cube. The connection fails with “Internal Error: An unexpected exception has occurred”. The connection used to work or works with SQL Server 2012 SSAS MD.
Resolution: On the SSAS 2014 server, install Cumulative Update 2 for SQL Server 2014. This article provides more details about the issue.
https://prologika.com/wp-content/uploads/2016/01/logo.png00Prologika - Teo Lachevhttps://prologika.com/wp-content/uploads/2016/01/logo.pngPrologika - Teo Lachev2015-02-24 13:57:532016-02-15 05:55:01Fixing Power View to SQL Server 2014 SSAS Multidimensional
Scenario: You have created an SSRS application in SharePoint and specified that the application pool would use a specific domain service account that is designated to SSRS. When you attempt to create a Power View report from a deployed Power Pivot model, you get the following error:
An error occurred while loading the model for the item or data source ‘<path to Excel file>’. Verify that the connection information is correct and that you have permissions to access the data source.
Resolution: The most important information is the message “SetAuthContext need to be run as sysadmin“. This tells us that the SSRS account doesn’t have admin access to the SSAS instance configured in SharePoint mode. Another way to confirm this is to run the SQL Profiler connected to the SSAS instance, e.g. SERVER\POWERPIVOT, and attempt to create a Power View report. You would see the same error message in the Profiler.
How do we fix this horrible issue? Connect to the SSAS instance in SSMS, right-click on the server node and then click Security. Then, add the SSRS account to the list to grant it admin rights to SSAS. This is something SharePoint should have done during the setup of the SSRS application since the SharePoint farm account has admin rights to the SSAS instance but apparently this step has been omitted.
Scenario: You need to visualize point-to-point geospatial data, such as routes from an origin location to destinations. The map region in Reporting Services (Report Designer or Report Builder) supports point-to-point mapping but more than likely your users would prefer an interactive report. As they stand, neither Power View nor Power Map support point-to-point mapping. Further down on the limitation list, Power View doesn’t support layers while Power Map does support layers but doesn’t support filtering, e.g. to allow the end user to select a specific origin. Point-to-point mapping is a frequently requested feature which I hope Microsoft will implement in a not so distant future. Meanwhile, you need to resort to workarounds.
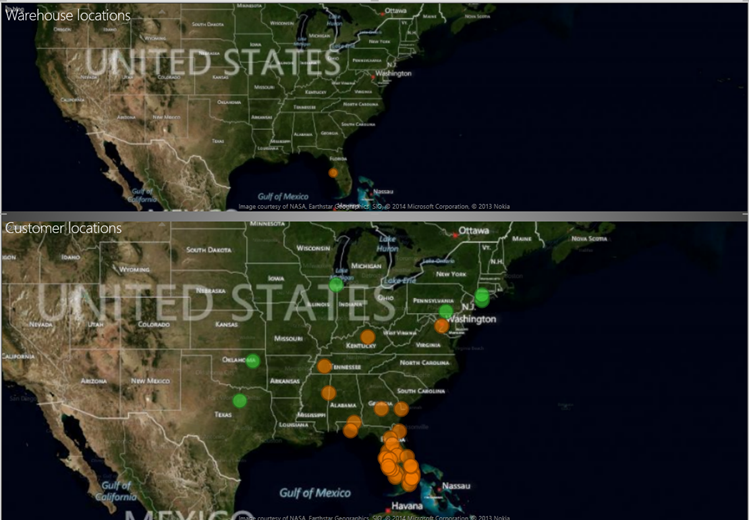
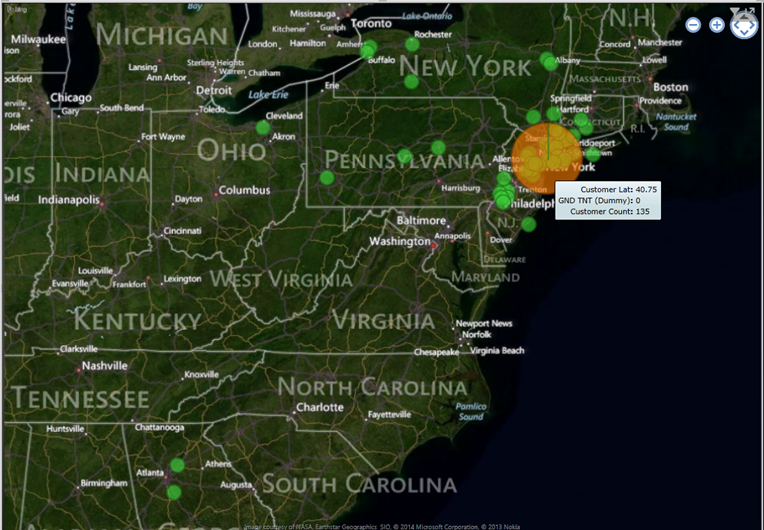
Workaround 1: If all the user wants to see is how far the destinations are located relative to a specific origin, consider creating a Power View report with two maps. The first map would allow the user to filter the origin and second map would plot the associated destinations. In the report below, the user has filtered a specific warehouse which is plotted on the first map. The second map shows the locations of the customers who receive shipments from that warehouse.
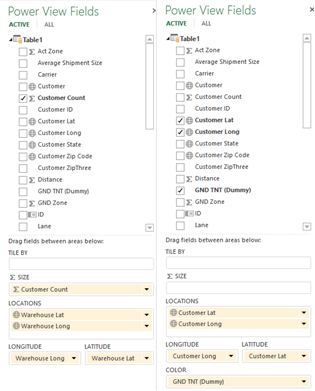
The following screenshot show you how the first and second maps are configured:
Workaround 2: If you prefer plotting both the origin and destinations on a single map, consider modifying your input dataset (Power Query can help automating this so you don’t have to do it manually) to append the distinct set of origins so you end up with both origins and destinations sharing the same latitude and longitude columns. In other words, you’ll append the origin set consisting of a distinct set of origins one more time to the original dataset. Then, you might want to introduce a Type column, e.g. with values Warehouse and Customer, to denote the type of each row. So that the origin stands out on the map, consider adding a DAX calculated column that does a distinct count over the destinations associated with that origin and use this column for the bubble size. Assuming a single dataset, this calculated column might use the following expression:
Although it might not be immediately obvious, Power View supports various options for exploring data in more details. Although some scenarios are not natively supported, workarounds could be available.
Drilling Down
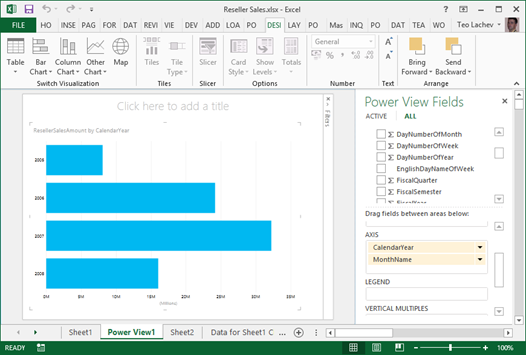
Drilling down involves navigating through multiple fields from the same or different dimensions to explore data at a lower granularity. Every interactive tool supports drilling down (and drilling up) and Power Pivot is no exception. For example, if you have a visualization that has multiple fields in a given zone, such as the AXIS zone, you can double-click a series to drill down to the next level. In the example below, I can double-click the Year series to see the data by Month.
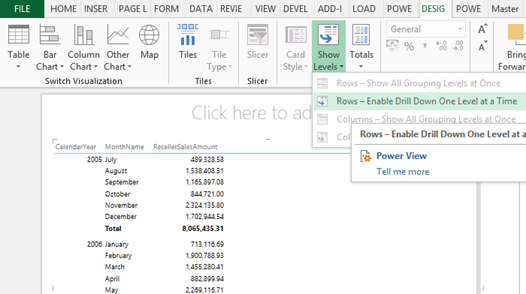
Drilling down is not automatically enabled for Table and Matrix visualizations because by default they show all fields in separate columns. What if you want one column but still be able to drill down?
If you haven’t done this already, convert the Table visualization to a Matrix visualization.
Expand the Show Levels button and click “Rows-Enable Drill Down One Level at a Time” assuming you want to drill down on fields placed on rows.
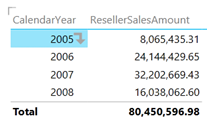
This will collapse all row fields to a single column. However, when the user clicks a field value, a down arrow indicates that this field is drillable. The user can click the arrow or double-click the field value to drill down or up if the field has been drilled to a lower level already.
Drilling Through
While drilling down is typically performed in the context of dimension tables, drilling through allows the user to see the details behind an aggregated value which is typically a numeric measure from a fact table. For example, Analysis Services and Power Pivot supports default drillthrough allowing the user to double-click on a cell in an Excel pivot report to see the individual rows as they were loaded from the data source, such as the sales transactions loaded from a ResellerSales fact table. As it stands, Power View doesn’t support Analysis Services actions and the user cannot double-click an aggregated value, such as on a field placed in the Values zone. Nor it allows the report to be extended with additional SSAS actions.
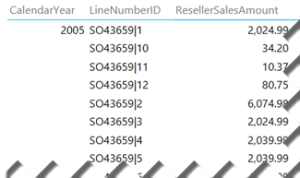
If you want to see the individual rows and the table includes a unique identifier, such as Transaction ID, you can simple drag that field on the Rows zone of a Table or Matrix report. If the table doesn’t have a unique identifier, you can manufacture one by concatenate multiple columns together. For example, the LineNumberID field in the screenshot below uses the DAX expression =[SalesOrderNumber] & “|” & [SalesOrderLineNumber].
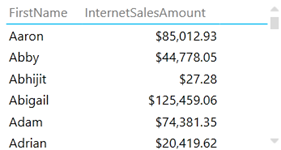
Sometimes, you may have duplicate field values, such as two customers who have the same first name. By default, Power View will show the distinct values and aggregate the results. For example, the following report shows a single row for Aaron although there are multiple customers whose first name is Aaron.
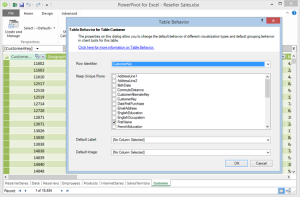
The modeler can use the Power View Table Behavior feature to instruct the client tools not to aggregate results across specific fields. For example, with the changes shown in the following screenshots, the report now will show as many Aaron rows as the number of customers that have Aaron as a first name.
Drilling Across
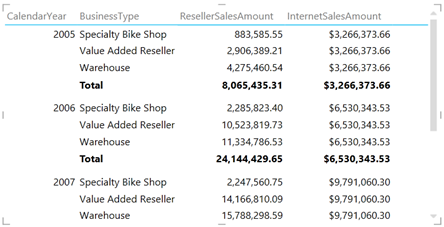
Drilling across allows us to analyze data across multiple fact tables at the same level of granularity assuming there are common (conformed) dimensions that join the fact tables. As a result, we can create a consolidated report that shows both ResellerSalesAmount from the ResellerSales table and InternetSalesAmount from the InternetSales table grouped by common subject areas, such as Date and Product. What happens if the report has to include a field that is related to only one of the fact tables? Power View will repeat the fact aggregates that are not related. For example, in the report below, InternetSalesAmount is repeated across BusinessType because this field is from the Reseller table which is not related to the InternetSales table.
NOTE Drilling across fact tables could be more challenging due to the way dimension relationships work. In SSAS and Power Pivot, relationships represent inner joins. Suppose you have two tables: FactOrdersPlaced and FactOrdersShipped. Both of them are joined to a Date dimension table. Let’s say that the user drills down to a particular order in FactOrdersPlaced and wants to see the transactions in FactOrdersShipped associated with the that order. Even if you have an Order Number dimension that joins FactOrdersPlaced and FactOrdersShipped, you won’t be able to get the expected results because the date when the order was placed will probably be different than the ship date. What you really need here is an outer join between fact tables. A workaround that works across all reporting tools is to add a consolidated fact table that combines the two fact tables. Another workaround that applies only to tools that support actions, such as Excel and PerformancePoint, is to create an SSRS report that queries directly the data warehouse.
https://prologika.com/wp-content/uploads/2016/01/logo.png00Prologika - Teo Lachevhttps://prologika.com/wp-content/uploads/2016/01/logo.pngPrologika - Teo Lachev2014-02-11 23:08:002016-02-15 09:12:46Drill Your Way with Power View
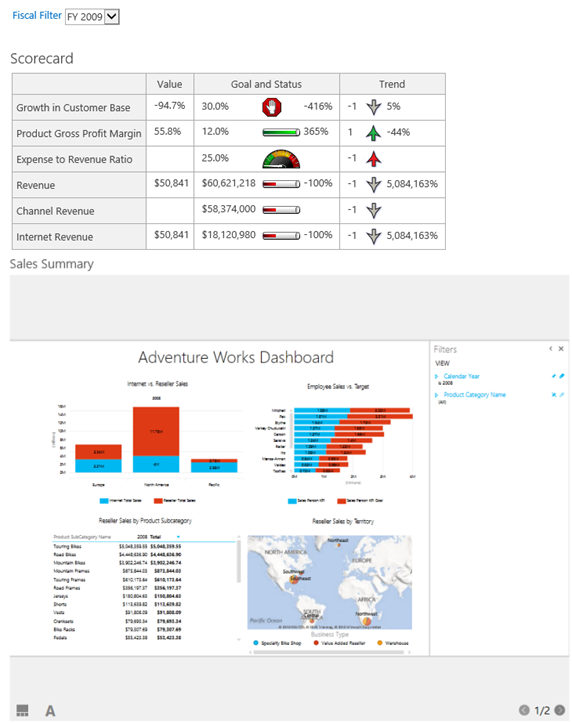
With the rising popularity of Power View, you may need to integrate it with PerformancePoint to jazz up your dashboards and make them more interactive. Take a look at the following, admittedly unpolished, dashboard which combines a PerformancePoint scorecard and Power View report.
What’s interesting is that the Power View report is synchronized with the dashboard filter. For example, when the user changes the filter to 2009, the Power View report filters on the same year. Starting with SQL Server 2012 SP1 CU4, Power View supports passing URL parameters using the syntax rf=[Table].[Field] eq Value. In this case I use the following Power View URL:
http://<site>/_layouts/15/ReportServer/AdHocReportDesigner.aspx?RelativeReportUrl=/PowerPivot Gallery/Adventure Works Dashboard.rdlx&ViewMode=Presentation&PreviewMode=True&PreviewBar=False&[Date].[Calendar Year] eq 2009
As you would quickly discover, the Power View customization is rather basic. The only operator supported for now is the equal operator (eq) and multi-valued parameters are not supported. The PerformancePoint integration is achieved by using the Web Page report type. Because of the mechanics of how PerformancePoint passes a parameter to a web page report (it always appends the Endpoint_Url query string containing the filter value), you’ll need a wrapper ASP.NET or HTML page that extracts this parameter and constructs the correct Power View URL. I opted for an ASP.NET page. Due to the SharePoint limitation that ASP.NET pages cannot have code-behind files, the PowerViewWrapper.aspx page, which I added to the Pages folder, includes the server side code:
<!DOCTYPE html PUBLIC “-//W3C//DTD XHTML 1.0 Strict//EN” “http://www.w3.org/TR/xhtml1/DTD/xhtml1-strict.dtd”>
Note: By default, SharePoint disallows custom code and the page will error out with “Code blocks are not allowed in this file”. To fix, this open C:\inetpub\wwwroot\wss\VirtualDirectories\80\web.config and change the PageParserPaths section as follows (allowing all pages with /* was the only way I was able to get the page to execute successfully:
The last part is to hook the Web Page report to the dashboard (no surprises here):
In the PerformancePoint Designer, add a Web Page report with an URL pointing to the wrapper page, such as http://<site>/bi/Pages/PowerViewWrapper.aspx?Dummy=1 (the Dummy parameter was added so ParseQueryString could parse the query parameter in the wrapper page).
Add the report to the dashboard.
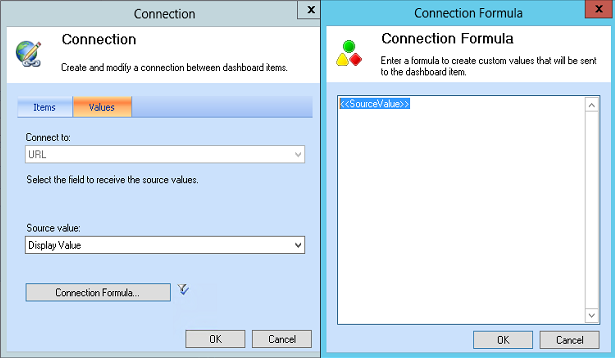
Drag the Display Value property of the filter and drop it onto the Web Page report zone.
In the Connection dialog box, click the Connection Formula button and configure it as follows:
The <<SourceValue>> placeholder returns the filter value, which PerformancePoint passes to the wrapper page, which in turn calls the Power View report.
https://prologika.com/wp-content/uploads/2016/01/logo.png00Prologika - Teo Lachevhttps://prologika.com/wp-content/uploads/2016/01/logo.pngPrologika - Teo Lachev2013-09-15 01:45:002016-02-15 10:55:44Integrating Power View with PerformancePoint