Posts

Power BI Report Builder

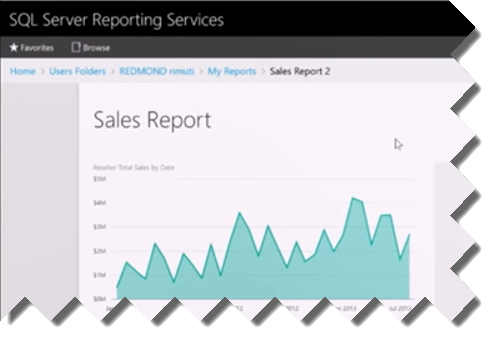
SSRS is near and dear to my heart. My first book (“Microsoft Reporting Services in Action” published in 2004 by Manning) was on this subject and I became an MVP because of my contributions around SSRS back in those days. Because of this and because every good thing should come in two, I rejoiced when I heard Microsoft announcing the Power BI Report Builder to complement the work they do to bring paginated reports to Power BI. Although lacking in interactivity, there are a few good reasons to favor SSRS paginated reports as they continue to be the most extensible and feature-rich report type in the Microsoft BI ecosystem, as I explained in more detail in my “Choosing a Reporting Tool” blog.

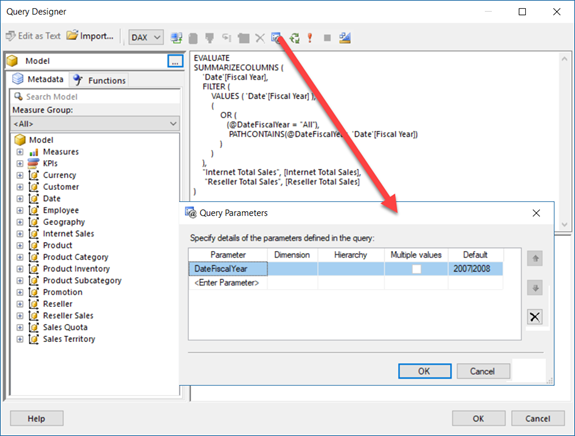
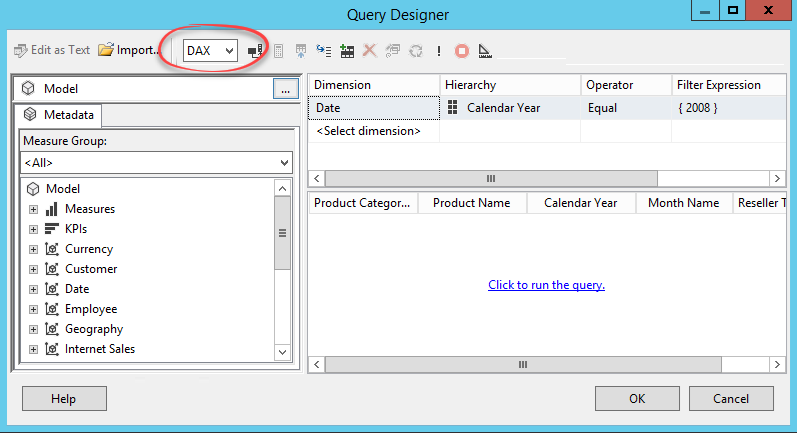
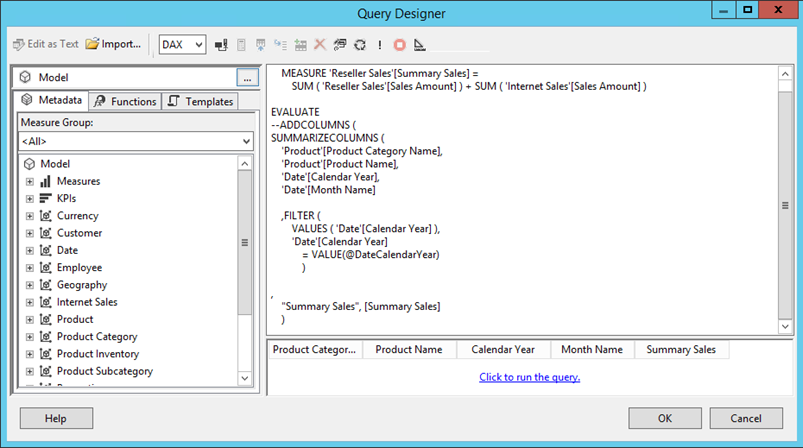
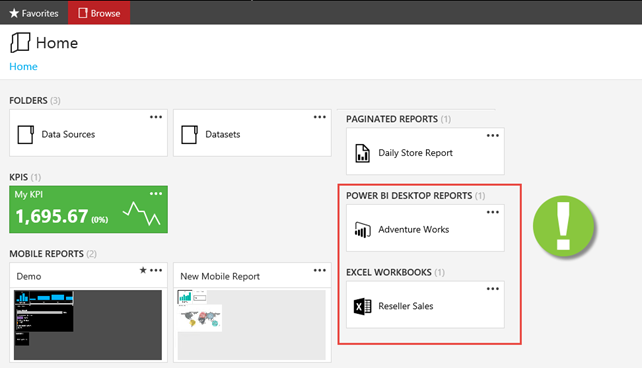
Like Power BI Desktop, we now we have two Report Builder tools. The SSRS Report Builder continues to support to full feature set of SSRS and targets deployment to a report server. Power BI Report Builder is tethered to Power BI (Power BI Premium to be precise since you can deploy paginated reports to Power BI Premium only for now). Not all SSRS features are currently supported in Power BI, such as shared datasets and shared data sources, drillthrough reports and subreports, but Microsoft is working hard to close the gap. For more information about the current limitations, refer to this article (however, besides a subset of data sources, I didn’t see any other feature restrictions).

I ran into two issues with the recently released update to Power BI Report Builder. First, when running a report, the tool throws an error “This method explicitly uses CAS policy, which has been obsoleted by the .NET Framework”. The simple workaround is to uninstall Power BI Report Builder and install it again.

Second, the Power BI XMLA point is currently down so don’t attempt to connect the Report Builder (or any other tool) to Power BI datasets published to a premium workspace. You’ll get an Unauthorized error. According to the current advisory, April 28th is the rough estimate when the fix will be deployed worldwide.

Unblocking MDX Queries from SSRS Reports

I love performance optimization. It’s exciting to peek under the hood and take a deep dive in the mysterious world of how Microsoft designed things. And it always humbles me by bringing forth gaps in my knowledge.

Scenario: You have SSRS reports that query Analysis Services Multidimensional cubes. When users request reports in Report Manager (aka Web Portal starting with SSRS 2016) and … the report hangs sporadically, without even getting to the ReportViewer page… for minutes. The server doesn’t appear to be under resource pressure. The issue happens when the cube is being processed. And no, this is not about locking.

Solution: This one wasn’t trivial to figure out. The profiler showed that when the report is requested, SSRS fires the first MDX query (typically, a query that populates the parameter available values). The breakthrough came when I executed the same query in SSMS while the SSRS one was blocked, and it executed immediately. With some help from Microsoft, it turned out that flattened rowsets (SSRS requests flattened rowsets), are serialized by threads in the SSAS processing pool. Indeed, once I enabled the Serialize events in the profiler, I noticed that the Serialize Results Begin event fires but not Serialize Results End.

022418_0254_UnblockingM1.png

So, if there are not enough threads in the SSAS processing pool, the flattened queries are queued. You can use the MSAS11 Threads: Processing Pool Job Queue Length counter to confirm that processing threads are queued. In this case, the queue length was about 200 threads when fully processing the database!

The resolution depends on your specific situation. If you have plenty of CPU cores, try increasing the pool size by increasing the ThreadPool\Process\MaxThreads SSAS setting. The default value of this setting is 0, causing SSAS to allocate the maximum of (64, number of logical cores). So, if you have a two-socket server with 16 hyperthreaded cores (32 logical cores), the maximum number of processing threads would be 64. On the other hand, if you see a high CPU utilization during processing, try reducing the parallelism of the processing task by using one of these three approaches:

  1. Reduce the maximum number of connections in the SSAS data source properties.
  2. Set the MaxParallel setting on the processing batch command.
  3. Reduce the CoordinatorExecutionMode SSAS configuration settings.

Also, I recommend you load test your production server to ensure that it has enough capacity. I did a “Can Your BI Solution Scale” presentation at TechEd 2011 about load testing SSAS and SSRS that shows how this could be done.

Many thanks to Akshai Mirchandani from the SSAS product team for shedding light in dark places.

SSRS Multivalue Parameters in DAX

UPDATE: Microsoft has added support for multi-valued parameters in the DAX Query Designer. Please read the discussion thread below for more info. You can use the approach discussed in this article if you need more control over the parameter handling, but the Microsoft-provided way should suffice for most cases and it’s easier to implement.

Déjà vu today with a twist. SSRS multivalue parameters in SSAS reports but this time in DAX. Now that SSAS Designer supports DAX queries, we should be able to do everything we were able to do in MDX, right? Unfortunately, as you will quickly discover, Microsoft “forgot” about multivalue parameters when working on the DAX Designer.

You can use MDX (no shame there) and write queries the old way, but if you are a DAX purist, you’d need to take the road less traveled which goes through the DAX rabbit hole.

Here are the high-level steps in the SSDT Report Designer/Report Builder and I tried my best to simplify this as much as I can:

  1. Do as much drag and drop using the DAX Graphical Query Designer to auto-generate the DAX query, as you won’t have another chance once you switch to a text mode. You can also use the graphical mode to declare your parameter(s) and to let SSRS autogenerate the report-level parameters and queries.
  2. If you let the DAX Query Designer auto-generate the parameter queries, change the Available Values of the report-level parameters to use ParameterCaption field (not the ParameterValue column). If the parameter uses default values, change the Default Values tab to set the default values by captions (not using pipe-delimited format that the DAX Designer auto-generates). Again, that’s because we’d use the parameter caption.
    011218_0216_SSRSMultiva1.png
  3. Go to the properties of the main dataset, flip to the Parameters tab and change the expression to concatenate the parameter values with a pipe “|”, such as =Join(Parameters!DateFiscalYear.Value,”|”). You’ll see why in a moment.
    011218_0216_SSRSMultiva2.png
  4. Now open the main DAX report query and switch to Text mode. Promise yourself never to go back to the Graphical mode (the one that lets you drag and drop). Click the Parameters button and reconfigure the parameter by selecting the empty value in the Dimension column. For testing the query inside the query designer, you might want to enter some pipe-delimited values in the Default column.
    011218_0216_SSRSMultiva3.png
  5. Change the main query to support multivalue parameters. The following query highlights the important changes:

    EVALUATE
    SUMMARIZECOLUMNS (
    ‘Date'[Fiscal Year],
    FILTER (
    VALUES ( ‘Date'[Fiscal Year] ),
    (
                OR (
                    ( @DateFiscalYear = “All” ),
                    PATHCONTAINS ( @DateFiscalYear, ‘Date'[Fiscal Year] )
                )
    )
    ),
    “Internet Total Sales”, [Internet Total Sales],
    “Reseller Total Sales”, [Reseller Total Sales]
    )

I removed the variable (VAR) definitions (not needed after simplifying the query). The filter expression uses an OR condition. If the user selects the parameter “All” value, then all rows are returned. If specific values are selected, the PATHCONTAINS function would return TRUE for that row in the filtered column (‘Date'[Fiscal Year] in this case) that matches one of the selected values. If you have more parameters, simply add more FILTER clauses.

I attach a report to demonstrate the changes.

Power BI Premium Reports on Mobile Devices

Can we surface Power BI reports deployed to Power BI Premium Report Server on mobile devices? Yes, and we have three quick options:

  1. Since Power BI reports render in HTML5, they should render in any modern browser.
  2. On iOS and Android devices, consider Power BI Mobile for optimum viewing experience. In Power BI Mobile, go to the Settings and click Connect to Server. Then plug in the report server URL, e.g. http://<servername>/reports. Note that the Power BI Mobile Windows app doesn’t support Power BI Premium Report Server yet. Also, by default your reports will only work if you are on your company intranet or the mobile device connects to your company VPN. To make reports available outside corporate network, you can configure a Web Application Proxy to tunnel in.
  3. For embedding reports on a page, have an HTML page with iframe that request the report by URL passing the embed parameter as explained here.

Power BI can’t reach to your report server? Don’t forget to configure the firewall on the Power BI Premium Report Server to allow inbound connections over port 80, as explained here.

SSRS Tabular Query Designer

Analysis Services Tabular has gained a lot of momentum for implementing organizational semantic models but its toolset has been lacking. SSRS developers had to rely previously on the MDX Query Designer to send MDX queries to Tabular. If DAX queries were preferred (and they often are for better performance since DAX is the native Tabular query language), developers had to type in DAX manually. And if the query would take parameters then the ugly workaround was to use … the DMX Query Designer.

As Chris Finlan announced yesterday, this will all change starting with the newly released Report BuilderSSDT 17 (currently in release candidate state), and SSMS 17 (also in RC state), as they now feature a Tabular Query Designer. SSMS also includes DAX Query Editor, as Christian Wade explains here.

If you’re familiar with the MDX Query Designer, you already know how to use the Tabular Query Designer. When you connect to Tabular, the query designer will discover it and default to DAX query mode. The dropdown allows you to switch to MDX should you prefer to send MDX queries to Tabular.

Similar to its MDX counterpart, in most cases you’d still need to know DAX to customize your queries. If you connect to Tabular version 2016 or above, you’d be able to drag and drop metadata to autogenerate the query. I think version 2016 or above is required because the designer relies heavily on the DAX SUMMARIZECOLUMNS function, which was introduced in 2016, when autogenerating queries.

The Design Mode lets you examine the underlying DAX query and customize it as needed. Sorry, no color coding or syntax checking in SSRS, so you’d probably rely on DAX Studio to code and test your queries or the new DAX Query Editor in SSMS which has syntax checking and IntelliSense.  The Calculated Member option is disabled and you’re on your own defining custom DAX measures. No big surprises here is it works exactly in same way as in MDX (of course you need DAX formulas, such as VALUE to convert to a numeric value).

It was about time for the Tabular Query Designer to appear to help us writing DAX when designing traditional SSRS reports connected to Tabular. Watch out for a bug where auto-generated parameter datasets error out when hierarchies are used. I attach two reports. Report.rdl demonstrated an auto-generated DAX query. ReportEx.rdl demonstrates a customized DAX query.

Power BI Reports in SSRS Techinical Preview

From the glimpse to the first public preview…it’s great to see one of most requested feature coming to life: ability to render online Power BI reports in on-premises SSRS. Alas, Microsoft is keeping us in suspense and no official date and release vehicles have been announced yet but we can now see and test it using the VM that Microsoft put on Azure (read the Chris Finlan’s steps to get started).

At this point, the integration supports only Power BI Desktop files that connect to Analysis Services (Multidimensional and Tabular). Attempting to deploy models connected to something else or with imported data, doesn’t work and you’ll get an error. Custom visuals and R visuals are not supported yet. For the most part, the integration is limited to report viewing only (similar to what you get if you embed Power BI reports in Power BI Embedded). That’s will be probably fine to start with but it will be nice to have Q&A, Quick Insights, Analyze in Excel, and ability to create custom reports online.

It’s great that Microsoft decided to expose the connection string as a regular SSRS data source. This will allow you to change the credentials settings, such as to impersonate the user when Kerberos is not an option and the SSAS is on another server. When the Power BI Desktop file is uploaded, it’s saved in the report catalog as any regular SSRS report (now referred to a paginated report). This means that you secure and manage Power BI reports the same way you work with paginated reports. Speaking of management, I hope that at some point Microsoft will add support for subscriptions and caching. What’s need is unification among the four types of reports: paginated, mobile, Power BI, and Excel. While waiting, we get a handy bonus feature: ability to add comments to reports, such as to get someone to formally approve what they see on the report.

Everyone is asking about SSRS support for Power BI reports. Progress has been make and I hope it won’t be long before we get the real thing.

A Glimpse of Embedding Power BI Reports in SSRS

The first public demo of the highly anticipated Power BI report embedding feature in SSRS 2016 on premises came from Microsoft Ignite. Scroll to the 58 minute in the Ricardo Muti’s “Create a modern enterprise reporting and mobile BI solution with SQL Server 2016” video and enjoy! I expect more details at SQL PASS SUMMIT at the end of this month. Thanks to Dan English for pointing out this video.

100716_0242_AGlimpseofE1.png

SSRS UX Changes in SQL Server 2016

SQL Server 2016 RC3 (last and feature complete RC) just came out for public review. It includes a couple of interesting UX enhancements. The first one is more of a teaser but shows you that Microsoft is committed to fulfill and go beyond its reporting roadmap. SSRS in native mode plays a central role in this roadmap as the on-premises BI reporting platform.

The new portal (the old Report Manager portal is gone BTW) now includes sections if you upload Power BI Desktop files and even Excel workbooks! For SQL Server 2016 RTM timeframe, clicking a file of these two types simply opens it on the client with the corresponding application (Power BI Desktop for PBIX files and Excel for Excel workbooks). So, no embedded web rendering yet but I guess these features won’t be there if Microsoft isn’t prepared to travel the full distance after RTM.

041616_2211_UXChangesin1.png

Second, we now have branding of the portal and mobile reports, as Chris Finlan explains in his “How to create a custom brand package for Reporting Services with SQL Server 2016” blog.

041616_2211_UXChangesin2.png

SSRS Treemap and Sunburst Charts

Years ago, I wrote a blog about how, with some code wizardry, you can create heat maps with Reporting Services. Moving to SSRS 2016, you don’t have to do this anymore thanks to the new Treemap chart type!

Speaking of new charts, SSRS also adds a Sunburst chart.


Integrate SSRS 2016 Reports with Power BI

As I said in the “Microsoft Unveils BI Roadmap” blog, SSRS will play an important role of the on-premises BI portal. With this post, I’ll start covering the new SSRS 2016 features. One of the Power BI features announced at the PASS Summit was the forthcoming integration between SSRS 2016 and Power BI that will allow users to pin SSRS report items to Power BI dashboards. You can test pining reports items to Power BI with SQL Server 2016 CTP 3.0 and later. The newly released CTP 3.2 also features the new sleek SSRS portal (we’ve come a long way!). The items you can pin currently include charts, gauge panels, maps, and images. Pinning a report item takes a few clicks:

  1. Open the report and click the Power BI button (a new toolbar button in SSRS 2016). If this is the first time you do this, you’ll be asked to authenticate with Power BI and grant SSRS special permissions it needs for pinning. Then, SSRS switches to a special page mode that shows which items can be pinned.

  1. Click the tile you want to pin.
  2. In the “Pin to Power BI Dashboard” window, select the dashboard you want to pin the report to and the update frequency that specifies how often Power BI will query the report for data changes.

And, the report item is pinned to the dashboard as a regular tile. You can click the tile to navigate back to the SSRS report.

As you can see, Power BI is becoming a focal point for cloud hosting of the main MS report artifacts: Power BI reports, Excel reports, and SSRS reports.