Posts

Top 10 Reasons for Choosing Microsoft Self-service BI

Every organization should have a strategy for self-service BI. As a rule of thumb, my advice is that 80% of the BI effort should be directed toward implementing organizational BI solutions (DW, ETL, data model, dashboards, big data, predictive analytics, and so on), while 20% should be left for completing self-service BI analytics. But which tool to choose for self-service BI? With so many vendors on the market, it’s easy to get persuaded by marketing propaganda and eye candy. My advice would be to start with what you already have. And, what you have is probably Excel. It’s common when I talk to clients to find that they don’t realize that the most if not all of their self-service BI needs can be met by the Excel self-service BI capabilities, many of which are unmatched by the competition.

Microsoft has built a comprehensive self-service ecosystem marketed under the Power BI name umbrella that should warrant your serious interest for at least the following reasons:

Flexible Data Schema

Unlike other tools that are limited to importing a single dataset, Power Pivot allows you to import and relate multiple datasets so your business users can build sophisticated models on a par with organizational BI solutions.

Easy Data Acquisition

Unlike other vendors who assume programming and scripting knowledge for data import, importing data with Microsoft self-service BI adopts a wizard-driven approach for importing data. In fact, in Excel business users have several ways to bring data into the data model depending on the data complexity, including Excel native data import (great for working with text files), Power Pivot (great for working with relational and other data sources), and Power Query (even more data sources). Currently, the preferred approach for best performance is to cache the data into the state-of-the art xVelocity in-memory store, but Microsoft is adding pass-through query capabilities as well.

Data Transformation

I don’t think that there is a self-service tool on the market that allows you to transform the data before it’s imported. By contrast, Power Query to Microsoft self-service BI is what SSIS is to organizational BI. Power Query supports a variety of data transformation tasks, ranging from simple tasks, such as combining and splitting columns, to a full-featured M language for advanced transformations.

Powerful Programming Language

A BI solution is rarely complete without business calculations that can range from simple aggregations to rather sophisticated business metrics. The Data Analysis Expressions (DAX) is a full-featured analytical language that you’ll be hard-pressed to find in competing products.

Flexible Reporting

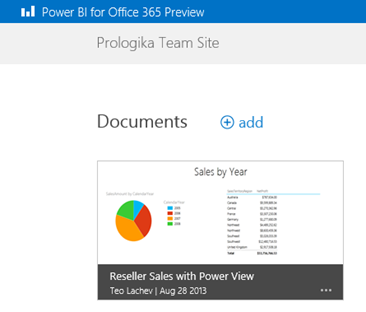
With a few clicks, business users familiar with Excel can use build Excel PivotTable and PivotChart reports connected to the Power Pivot data model. If you need more eye candy, Power View should help. While you might find that the current presentation toolset has left a room for improvement, check what’s coming up in Power BI vNext.

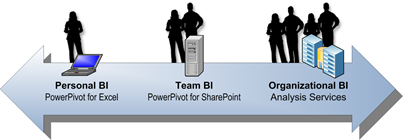
Performance and Scaling

Most popular self-service BI vendors offer desktop-based solutions that import data in files. When it comes to scaling out, these vendors fell short. By contrast, an organization that has adopted Microsoft self-service BI can easily scale out data models originated by Business to enterprise data models powered by Analysis Services and sanctioned by IT.

Q&A

Your users don’t know how to get started with the BI model someone else built? Everyone loves the Power BI Q&A feature that lets users type semantic questions, such as “show me sales for last quarter”. None of the popular self-service BI vendors have currently a similar feature, although it looks like startups, such as ThoughtSpot, are rallying to offer similar offering.

Flexible Deployment

Don’t use Excel or Office 365? Have SharePoint on premises or cloud? Don’t have or care about SharePoint? The coming Power BI vNext (free and paid versions) and Power BI Designer removes adoption barriers by allowing you to implement self-service BI outside Excel and SharePoint. My newsletter on this subject provides more details.


Cloud on Your Terms

If you are looking for a cloud-based BI platform, Power BI is just that. And, with Power BI vNext you don’t have to upload your data. Data can stay on premises, such as in a Tabular model or a cube, while your reports can be deployed to the cloud. Moreover, you are always up-to-date with the latest features.

Great Partner Ecosystem

One of the greatest strengths of Microsoft is having a great partner ecosystem and readily available talent.

Cost

OK, that’s the 11th reason but it’s hard to pass free given that the Power tools (Power Pivot, Power Query, Power View, and Power Map) are either bundled with Excel or available for download) and Power BI vNext cloud offering has a free Power BI Designer and a free cloud edition.

While Microsoft self-service BI is not perfect, it should warrant your interest if you are on the market looking for a tool. Sometimes, all we need to do is appreciate what we already have.


SharePoint 2010 and Excel 2013 Power Pivot

I’ve start seeing customers moving to or considering Office 2013 for self-service BI. Naturally, the end users would like to share their Excel 2013 self-service data models by deploying to SharePoint. Does SharePoint 2010 support this scenario? Unfortunately not. The user can upload Excel 2013 files and view the embedded reports. However, when he attempts to perform an interactive action (triggers all backend services involved in processing Power Pivot workbooks) he gets the dreaded error “Unable to refresh data for a data connection in the workbook”. What’s wrong in this case is that due to the Excel 2013 changes to support Power Pivot natively, Excel Services must load the data model in a different way. This is discussed in more details in the “‘Unable to refresh data for a data connection in the workbook’ error when you interact with an Excel 2013 workbook in a SharePoint Server 2010 farm” article by Microsoft. Note that the only resolution path is to upgrade to Share Point 2013.

Again, the issue is with Excel Services and not with the Power Pivot version. If the user has Excel 2010 with the latest Power Pivot bits (SQL Server 2012 SP1 version of Power Pivot), then the SharePoint 2010 integration works. To make the upgrade story short:

  1. Match SharePoint version with the Office edition. If you need to support Excel 2013 Power Pivot workbooks, upgrade to SharePoint 2013.
  2. The SQL Server instance behind Power Pivot for SharePoint must match the Power Pivot version on the client. For example, if the users have Excel 2010 with the SQL Server 2012 SP1 version of Power Pivot, the SQL Server instance installed on the SharePoint server should be SQL Server 2012 SP1. SQL Server 2008 R2 won’t be able to handle the latest Power Pivot bits.

This is definitely something to watch and plan for when considering upgrading to Office 2013.

Flavors of Self-service BI

My Fall newsletter entitled “Why a Semantic Layer?” is out and it will be e-mailed to subscribers on Monday. The reason why I wrote is to bring the focus back on organizational BI. Based on my experience, decision are makers are confused about what their company’s BI strategy and roadmap should be. I’ve asked a BI manager recently if he knows that a semantic layer could be a true self-service BI enabler and he said he didn’t know. After talking to some well-known BI vendors and listening to their “pure” self-service mantra, the focus was shifted from a comprehensive BI architecture that truly addresses the company needs to selecting a tool that has the most visualization fluff.

In general, there are two self-service BI paths your organization can take:

  • Semantic layer + ad hoc reporting – If your organization decides to invest in implementing a comprehensive organizational BI framework (see the diagram in my newsletter) that features a semantic layer, the end user’s focus will be where it should be: on data analysis and not on building models. For example, end users can use Excel, Power View, or whatever third-party data visualization tool your company felt in love with, to connect to the semantic layer and create insightful ad hoc reports with a few clicks. No need to import data and build models before the business users ever get to data analysis.
  • Self-service models – In this scenario, you put the responsibility on end users to create models and their version of the truth. Following this path, an end user would use a tool, such as Power Pivot, to import data, create a model on the desktop, and then derive insights from the data. Don’t get me wrong. There are good reasons when this path makes sense, including the ones I mentioned in my blog “Does Self-service Make Sense”.

Ideally, your BI roadmap should consider and plan for both paths although the focus should be on organizational BI first and then finding gaps that self-service BI could address, such as testing ideas requiring external data. If your organization relies only on “pure” self-service BI, it won’t be long before you’ll find out that the pendulum has swung the wrong way. Many have taken this road but the outcome is always the same: “spreadmarts” that might get the work done in the interim but would fail in a long run. As a rule of thumb, I recommend the 80/20 principle, where 80% of the effort is spent on organizational BI (DW, ETL, semantic layer, dashboards, operational reports, data mining, big data, etc.) and 20% is left for self-service BI. But each organization is different so the ratio might vary.

Let me know your thoughts.

Power BI (Part 1 – Getting Started)

Microsoft BI has been criticized about its complexity and price because it requires SharePoint Server Enterprise for deploying Power Pivot models and dashboards. Microsoft introduced Office 365 (E3 or E4 plan required) and SharePoint Online (Plan 2 required) to mitigate such concerns and allow you to host Power Pivot and Power View in the cloud. Power BI is the next step in the Microsoft BI cloud strategy. As I explained in a previous blog and in the SQL Server Team blog, Power BI is essentially a cloud combo of all the self-service “power” tools (Power Pivot, Power View, Power Query, and Power Map) available on a subscription basis and running on Microsoft Azure, precluding SharePoint on-premises installation and licensing.

Microsoft has started inviting participants subscribed to the Power BI for Office 365 Preview to test the prerelease version of Power BI. During the Worldwide Partner Conference, Amir Netz, a Technical Fellow at Microsoft, demonstrated some of the Power BI most exciting features. With the exception of Power View HTML5 preview, none of these features (on-premise data refresh, natural query, and InfoNavigator) are in the Preview yet. However, Microsoft is planning to refresh the Preview on a monthly basis and push these features as they become available. Pricing hasn’t been announced yet. One disappointing news for me is that for now Microsoft doesn’t plan to support the “mixed” scenario by connecting Power View to an on-premises semantic model (Multidimensional or Tabular). In other words, in its first release Power BI will be limited to supporting Power Pivot models only, excluding organizational BI capabilities both on cloud and on premises.

The setup experience is simple and it should be familiar to you if you’ve provisioned Office 365 in the past. The invitation letter includes links to the following resources to get you started with Power BI.

  1.   View the Power BI Provisioning Video and the provisioning guide
  2.   Visit the getting started page and check out the Power BI user guide and samples
  3.   Download the Power Query and Power Map add-ins for Excel
  4.   Download the Power BI mobile app for your Windows tablet
  5.   Monitor new feature announcements on the Power BI Blog
  6.   Give us feedback on the Power BI forum

One provisioning step that you need to pay attention to is that you have to go to Users and Group section of the portal and assign yourself licenses to get access to the SharePoint sites.

083113_1355_PowerBIPart1

Once you’ve done this and navigate to the Sites and then Team Site, you’ll see a link to the Power BI site. The Power BI site supersedes Power Gallery. It’s the hosting site for deploying Power Pivot models for up to 250 MB in size.

083113_1355_PowerBIPart2

Once you click deploy an Excel file with your Power Pivot model and reports, you can click it to render the reports in the browser. If the file includes a Power View report, Power BI would render it by default in Silverlight but gives you an option to try the new HTML5 preview by clicking the Try the Preview button in the bottom right corner, as explained in this blog. I ran into several issues during testing, including:

  • The Power BI site doesn’t always render
  • The Power View Field List doesn’t always show
  • The HTML5 preview generates empty rows. A list of the HTML5 supported features can be found here.

I believe that many organizations and ISVs will find Power BI attractive for cloud deployments of self-service and team BI solutions. Power BI mitigates concerns about on-premises SharePoint licensing, complexity, hardware and software overhead.

Does Self-service BI Make Sense?

Besides data messiness (in direct proportion with the company size), another common data-related challenge that every organization nowadays is trying to tackle is how applicable self-service BI is to their business and to what extent it should be used. The tools are here and they are readily available. For example, given that Power Pivot is now natively integrated with Excel 2013, your power users will find a way to get inspired even if you don’t roll out a formal self-service BI strategy.

When self-service BI make sense

Having consulted with and trained many organizations ranging from small companies to Fortune 100 behemoths, I think that the following two scenarios appears as good reasons for self-service BI:

  1. Organizational BI is not an option. For example, a small company might not have resources to roll out an organizational BI solution, such as a management dashboard, and the data doesn’t require extensive transformation. Or, the IT department in a larger organization might be unable to keep up with business requirements, thus leaving business users on their own.
  2. Foster lateral (sometimes called divergent) thinking to generate and test ideas. Your business users might have “sketches” of alternative business scenarios or hypotheses that need to be tested quickly. For example, a business analysis in an oil services company wanted to know if the number of deployed rigs is correlated to the company’s revenue. In such cases, self-service BI can help that user to quickly mash up the revenue numbers stored in the data warehouse with the rig counts given to him as an Excel spreadsheet. Once the data that support such ideas is available and related to the organizational data, business analysts can test and converge such ideas to isolate the ones that are truly useful. Ideally, the next steps will be import the supporting data to the data warehouse so it’s available across the entire organization. Among the BI vendors, Microsoft is unique in providing the tools to implement this continuum, which might consists of self-service, team, and organizational BI steps.082913_1445_DoesSelfser1

When self-service BI doesn’t make sense

Let’s now mention scenarios when self-service BI might not be a good fit:

  1. Replacing organizational BI. By now, we all know that vendor claims stating that you don’t need organizational BI didn’t stand the test of time. Self-service BI alone is not going to solve your data integration and BI challenges. Most organizations will greatly benefit from a centralized data repository with clean and trusted data, which is typically referred to as a data mart or data warehouse, and a semantic model on top of it. Moreover, no matter how simple the tools are, self-service BI typically exceeds the skills of most information workers. Have you tried teaching a typical sales person how to create an Excel pivot report? Therefore, self-service BI should be viewed as completing, not competing, to organizational BI.
  2. Creating “spreadmarts” and Excel data dumps. If you’ve spent so much effort to centralize the data in a data warehouse, does it make sense to pull it out in different directions? If all the end users need is Excel data dumps, does it make sense to allow them to import millions of rows (probably requiring hardware and software upgrade) while a Power View on top of analytical model might be a better option? How secure that data will be on the user laptop? Finally, do you trust that the models your business users create can be used for deriving important decisions?

Still struggle with a self-service BI strategy or how to implement it? My Applied Power Pivot class and book should be able to help.

Power BI Expands Microsoft Cloud Self-service BI

Expanding its Office 365 feature set, Microsoft introduced Power BI. Power BI is an umbrella name of the following BI offerings in the cloud: Power Pivot, PowerView, Power Query (previously known as Data Explorer), and Power Map (previously known as GeoFlow), plus more. Microsoft demonstrated Power BI at WPC yesterday (scroll to the 30th minute marker to see the Amir’s heart attack-provoking demo) or see the YouTube extract.

The “more” is the intriguing part to me:

  • Data Management Gateway – not sure how exactly this will work but it will provide some sort of connectivity to on-premise data so you can schedule PowerPivot data refreshes between the Microsoft cloud and your corporate data. Expect your ISP speed provider speed to be a limiting factor here so don’t hope for fast refreshes of millions of rows.
  • BI Sites – a dedicated SharePoint site that will support finding and collaborating on BI artifacts.
  • Mobile support – Power View is going HTML5!
  • Natural language query – Amir covered this interesting feature pretty well. I don’t know how it works behind the scenes yet (probably a natural language-to-DAX translator).
  • Data views – data stewards can publish datasets so they can be easily discoverable by Power Query.
  • King of the Hill – an interesting new PowerView visualization (demonstrated by Amir toward the end of the demo).

We don’t know at this point when these features will make to on-premise SharePoint, which probably would have been a better starting point for these enhancements. And, pricing hasn’t been announced yet. Look for Power BI toward the end of the summer if cloud self-service BI makes sense to your organization.

Office 2013 and SharePoint 2013 Go Live

I have to admit this came as a surprise to me as I expected them to go live next year. Microsoft just announced that Office 2013 and SharePoint 2013 went live. Time for celebrating, learning, and adopting these great technologies!

Check my coverage about what’s new in Office and SharePoint 2013 BI.

Applied PowerPivot Course Available

082310_0058_PowerPivotT1I am excited to announce that Prologika has added an Applied PowerPivot course to the list of our training offerings in response to the strong interest for self-service BI. The class can be delivered as two-day online class (4 hours each day) or as one full-day onsite class. The cost for the online version is $599. Applied PowerPivot is designed to help students become proficient with PowerPivot and acquire the necessary skills to implement PowerPivot applications, perform data analysis, and share these applications with other users. The full course syllabus is available here. I scheduled the first run for September 21st. Happy self-service BI!

PowerPivot Implicit Data Conversion

A student noticed an interesting behavior while I was teaching my PowerPivot class last week. He noticed that PowerPivot lets you join a text-based column to a numeric column. As it turns out, PowerPivot does an implicit conversion to text when it discovers that you are attempting to join columns of different data types. However, as a best practice, you should convert numeric columns to a numeric data type, such as Whole Number. This will help PowerPivot minimize storage and improve performance.

Professional Microsoft PowerPivot for Excel and SharePoint

I had the pleasure to read the book Professional Microsoft PowerPivot for Excel and SharePoint by Sivakumar Harinath, Ron Pihlgren, and Denny Guang-Yeu Lee. All of the authors are with the Microsoft Analysis Services team. Together with David Wickert, Denny Lee runs the http://powe073110_0327_Professiona1rpivottwins.com/ blog, which is “dedicated to all things PowerPivot”. Siva has written the 2005 and 2008 editions of the Professional SQL Server Analysis Services with MDX. So, the book is straight from the horse’s mouth.

I really liked the book. It’s easy to follow and includes insightful tips. The book targets business users who are interested in creating self-service BI solutions. IT professionals and BI practitioners who will manage PowerPivot applications will find the book useful as well. Professional Microsoft PowerPivot for Excel and SharePoint incudes tutorials that walks the user through the necessary steps to build a PowerPivot-based solution. These steps include importing the data, enriching the data model, creating calculations, and reports. The code samples use a sample database for the healthcare industry – I guess that’s because healthcare is the only industry with a budget for IT applications nowadays, or at least self-service BI apps. Adventure Works is probably waiting for the economy to bounce back.

The authors are quick (page 17) to explain the role of the Corporate BI now that the self-service BI era has dawned on us – something that I was eager to get the official Microsoft opinion about. Their short answer is “not much will change”, and that’s precisely what I think. IMO, self-service BI is a compromise between corporate BI (best) and reality. Ideally, I don’t want business users to do anything but analyze. Why should business users import, relate data, and create calculations that as complexity increases look more bizarre then the equivalent MDX expressions? But we don’t live in a perfect world and PowerPivot comes to fill in the void. Here are some scenarios where PowerPivot might be a good fit:

1. You don’t have a data mart and Excel spreadsheets rule the reporting world. With some help from IT, business users might be able to get the data in the right format and report from it right in Excel.

2. You do have a data mart but you don’t want/don’t have the skills to build a cube. But if you’ve gone that far, why not travel the remaining 20% and have a cool cube that business users trust and love?

3. You have a data mart/cube but not all data is in the data mart/cube or you need to mash up data from various data sources.

4. You suffer from the NIHS (Not Invented Here Syndrome) and you just want to do things your way despite what IT and BI guys like your humble correspondent tell you.

All of these scenarios require compromises in terms of data quality, security, features, and implementation effort. The problems that we aim to solve with corporate BI are not trivial and there are no shortcuts. I know it and you know it. So, be skeptical when you see an impressive presentation that shows how a self-service BI will take upon the corporate BI, no matter if the tool is PowerPivot, QlickView, Tableau, or something else.

Overall, I’d highly recommend this book to anyone interested in PowerPivot and self-service BI. The book does a great job explaining the capabilities and limitations of the tool. I couldn’t stop reading it!