I’m preparing for the new Azure Data Engineer exam, which is one of options to maintain a Gold Certification for Data Analytics for MS partners that has to be renewed annually. I’m really impressed by the Azure Learning Path self-paced environment that Microsoft put together. The training material is top-notch, and I actually learn some practical and useful stuff from the covered topics on ADLS, ADF, Synapse, etc. And you can even practice in an Azure sandbox environment that Microsoft sets up and tears down for you! It’s clear that tremendous effort has gone into setting this online and free learning option. No excuse to not certify anymore …
Register for my next online Power BI Dashboard in a Day (DIAD) workshop and hone your data analytics skills! Drive value for your organization and on the road to recovery after COVID-19. Attend from anywhere for only $199. I’ll teach you practical Power BI knowledge and data analytics skills that you can immediately apply to your job. See how Power BI can improve your usability and productivity even further.
https://prologika.com/wp-content/uploads/2016/01/logo.png00Prologika - Teo Lachevhttps://prologika.com/wp-content/uploads/2016/01/logo.pngPrologika - Teo Lachev2020-04-18 17:36:432020-04-18 17:38:59Virtual Power BI Dashboard in a Day (DIAD) on April 30
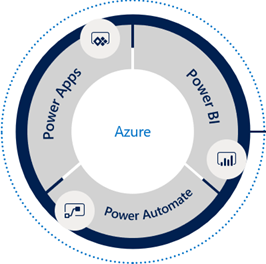
Take advantage of this exclusive opportunity to increase your data IQ from the comfort of your home wherever you are! Register today for my instructor-led digital training events and learn the Microsoft Power Platform consisting of Power BI, Power Apps, and Power Automate.
The workshops will be conducted online. Login instructions will be sent to registered attendees before the event.
https://prologika.com/wp-content/uploads/2016/01/logo.png00Prologika - Teo Lachevhttps://prologika.com/wp-content/uploads/2016/01/logo.pngPrologika - Teo Lachev2020-04-05 18:02:372020-04-05 18:02:37Two Virtual Workshops to Learn the Power BI Platform
Data Analysis Expressions (DAX) is the expression language of Power BI, Power Pivot, and Analysis Services Tabular. It’s very powerful but it’s perceived as complex, requiring a steep learning curve. I’m excited to announce a new 2-day “Applied DAX with Power BI” workshop that I designed to help you become proficient with DAX. You’ll learn practical skills that will help you tackle a wide range of reporting requirements. We’ll start with DAX fundamentals, such as calculated columns and measures, and then progress to more advanced concepts, including such as context transitions, variables, filters, time intelligence, advanced relationships, row-level security, query optimization, and much more. Think of this workshop as Advanced Power BI and the next level from my “Applied Power BI” class. The target audience is data analysts and BI developers wanting to hone their DAX skills with Power BI, Power Pivot, or Tabular.
Here is my entire training catalog with a brief description and link to each course page.
This two-day workshop is designed to help you become proficient with Power BI and acquire the necessary skills to work with online and on-premises data, implement data models on a par with professional models created by BI pros, unlock the power of data by creating interactive reports and dashboards, and share insights with other users. No prior data modeling or reporting knowledge is assumed. Students are welcome to bring their own data to the second day of the class.
Data Analysis Expressions (DAX) is the expression language of Power BI, Power Pivot, and Analysis Services Tabular. It’s very powerful but it’s usually perceived as complex requiring a steep learning curve. This two-day class is designed to help you become proficient with implementing business calculations with Data Analysis Services (DAX).
Targeting BI developers, this intensive 5-day onsite class is designed to help you become proficient with Analysis Services and acquire the necessary skills to implement Tabular and Multidimensional semantic models. Use the opportunity to ask questions and study best practices that will help you achieve a single version of the truth by implementing scalable and secure organizational models. Bring your organizational BI to the next level by learning these two powerful BI technologies in one class!
SQL Server is the most deployed and popular database today. Different types of users need to query data stored in SQL Server data structures. This 2-day instructor led course provides you with the necessary skills to query Microsoft SQL Server databases with Transact-SQL. This course starts with the basics of a SELECT statement and its syntax, and progresses to teach you how to join, aggregate, and convert data.
This four-day class is designed to help you become proficient with the Microsoft BI toolset and acquire the necessary skills to implement an organizational BI solution. You’ll learn how to design a star schema, use SQL Server Integration Services to transform data, and implement a Tabular semantic model. Depending on the students’ skillset, it can be customized, such as to reduce coverage of specific technologies, replace them with other topics of interest, such as Multidimensional instead of Tabular, or cover additional topics, such as Power BI or Reporting Services.
Microsoft SQL Server Reporting Services has evolved into a sophisticated reporting platform that lets you present and analyze data consistently, quickly, and reliably. This intensive 3-day class is designed to help you become proficient with Reporting Services and acquire the necessary skills to author, manage, and deliver reports.
This intensive four-day class is designed to help you become proficient with Analysis Services (Multidimensional) and acquire the necessary skills to implement OLAP and data mining solutions. Learn how to build a cube from scratch. Use the opportunity to ask questions and study best practices!
If your organization have Analysis Services Multidimensional cubes or Tabular models and you want to gain valuable insights from them in Excel, then this course is for you. Designed as a step-by-step tour, this course teaches business users how to become data analysts and unlock the hidden power of data. You’ll learn how to apply the Excel desktop BI capabilities to create versatile reports and dashboards for historical and trend analysis.
Power BI is a suite of products for personal business intelligence (BI). It brings the power of Microsoft’s Business Intelligence platform to business users. At the same time, Power BI lets IT monitor and manage published models to track their usage, security, and estimate hardware and software resources. With Power BI, anyone can easily build personal BI models using the most popular tool – Excel and share them on premises or the cloud.
This two-day class is designed to help you learn the visualization tools that are included in the Microsoft Data Analytics Platform. We’ll start by exploring the Excel reporting capabilities that include pivot (PivotTable and PivotChart) and Power View reports. Then, you’ll learn how to explore data interactively with Power BI Desktop. During the second day of the class, we’ll focus on learning how to create paginated reports with Reporting Services. The class can be customized to discuss other tools, such as SSRS mobile reports or Power Map reports.
This two-day class is designed to help you become proficient with Master Data Services (MDS) and Data Quality Services (DQS). IT and business users learn how to design MDS models and extend them with business rules, attribute groups, and hierarchies. IT will learn how to integrate MDS with upstream and downstream systems and how to enforce secured access. Business users will learn how to use Excel to manage data with the tool they love most!
2
https://prologika.com/wp-content/uploads/2016/01/logo.png00Prologika - Teo Lachevhttps://prologika.com/wp-content/uploads/2016/01/logo.pngPrologika - Teo Lachev2018-09-12 08:23:172018-09-12 11:15:20New “Applied DAX with Power BI” Workshop
Are you looking for an agile self-service platform that doesn’t require reporting and query skills to get basic analytics done without reliance on IT? Or, perhaps you’ve heard or evaluating Power BI but not sure where to start or how to take the most out of it? If so, this workshop is for you. A year ago Microsoft unveiled the new Power BI platform consisting of the PowerBI.com cloud service, Power BI Desktop, and Power BI Mobile. Since then, Prologika has helped organizations of all sizes to adopt Power BI. Packed with features, Power BI supports a dizzying variety of features and integration scenarios and it offers plenty to all types of users interested in data analytics: information workers, data analysts, BI pros, and developers.
Reserve your seat today to attend this insightful 2-day workshop for only $999 (use coupon POWERBI20160914 to get 10% discount when signing up two or more people) at the Microsoft Office in Alpharetta, when Teo Lachev (CEO of Prologika, a Power BI Red Carpet Partner) teaches you practical Power BI knowledge and data analytics skills that you can immediately apply to your job. See how Power BI can improve your usability and productivity even further.
Understand how Power BI changed the way users (information workers, data analysts, BI pros, and developers) gain and share data insights.
Learn how to connect to popular cloud services to derive instant insights, create interactive reports and dashboards, and view them in the browser and on the go.
Discover how to integrate and transform data from virtually everywhere and then implement sophisticated self-service models and business calculations.
Find how to implement hybrid architectures and strict security requirements by leaving data on premise and deploying reports and dashboards to the cloud.
Learn how to share your BI artifacts and collaborate with other teammates.
Gain practical skills by creating a self-service model in the lab exercises.
Learn Power BI best practices, limitations (every tool has them) and workarounds.
Get your questions answered.
and much more…
You won’t want to miss this educational and engaging training event! Attend it and get a free paper copy of the bookApplied Microsoft Power BI! Please registertoday as seating is limited.
Audience
Information workers
Business analysts
BI professionals
In general, anyone interested in self-service data analytics with Power BI
Prerequisites
Students are encouraged to bring their laptops for the exercises. Detail setup instructions and source files will be sent before the event.
Instructor
Teo Lachev is an internationally-recognized authority on Data Analytics and CEO of Prologika. Teo helps organizations make sense of their most valuable asset: their data. His strategy formulation, trusted advisory and mentoring, design and implementation services empower his clients to apply effectively data analytics in order to understand, improve, and transform their business. Teo has authored and coauthored several books and his latest one is “Applied Microsoft Power BI (Bring your data to life!)” He has been leading the Atlanta Microsoft Business Intelligence group since he founded it in 2010. Microsoft has recognized Teo’s expertise and contributions to the technical community by awarding him the prestigious Microsoft Most Valuable Professional (MVP) for Data Platform award since 2004.
https://prologika.com/wp-content/uploads/2016/01/logo.png00Prologika - Teo Lachevhttps://prologika.com/wp-content/uploads/2016/01/logo.pngPrologika - Teo Lachev2016-08-08 21:43:002016-08-08 22:47:132-Day Applied Power BI Workshop – Atlanta
A year ago Microsoft unveiled the new Power BI platform consisting of the PowerBI.com cloud service, Power BI Desktop, and Power BI Mobile. Since then, Prologika has helped organizations of all sizes to plan and adopt Power BI. Packed with features, Power BI supports a dizzying variety of features and integration scenarios but it might be difficult to understand how Power BI fits in your data analytics ecosystem.
Join Prologika and Microsoft for a 3-hour free seminar on Wednesday, August 31th, 8:30 AM -12 PM ET, at the Microsoft Office in Alpharetta, when Teo Lachev (CEO of Prologika) and Brian Jackson (Cloud Solution Architect at Microsoft) share practical knowledge and experience to help you to formulate a Power BI enterprise strategy. If you’re considering Power BI but you’re not sure how it fits within your organizational data strategy, this event is for you.
Key Takeaways
Understand how Power BI changed the way users (information workers, data analysts, BI pros, and developers) gain and share data insights.
Learn 10 areas where Power BI excels compared to other popular BI tools, such as Tableau, Qlik Sense, Sisense, Domo, and others.
Plan a data access strategy for:
Importing data
Connecting live to cloud sources with content packs and solution templates
Connecting live to on-premises data sources
Implementing real-time dashboards
Embedded reporting
Taking a deep dive to learn how Prologika designed and implemented a hybrid architecture solution for a Fortune 50 organization and meet security requirements that prevented exporting data to the cloud
Join in a discussion about other business use cases and gaps between Power BI and other BI products, and find how to address them. Get your questions answered.
9:00-10:30 – How Power BI empowers businesses like yours
10:30-10:40 – Break
10:40-11:45 – Plan a data access strategy and go “under the hood” of a hybrid architecture case study
11:45-12:00 – Q&A
Presenters
Teo Lachev is an internationally-recognized authority on Data Analytics and CEO of Prologika. Teo helps organizations make sense of their most valuable asset: their data. His strategy formulation, trusted advisory and mentoring, design and implementation services empower his clients to apply effectively data analytics in order to understand, improve, and transform their business. Teo has authored and coauthored several books and his latest one is “Applied Microsoft Power BI (Bring your data to life!)” Prologika is a Microsoft Gold Partner in Data Analytics, demonstrating a “best-in-class” ability and commitment to meet Microsoft customers’ evolving needs and distinguishing itself within the top one percent of Microsoft’s partner ecosystem. Learn more at www.prologika.com.
Brian Jackson is a Microsoft Certified Architect and Cloud Solution Architect at Microsoft. He has deep technical expertise in the SQL Server and Azure platform and served as a subject matter expert for Microsoft’s SQL Server Master and Business Intelligence certification programs. Brian has more than 20 years of experience in solution architecture and software development with a focus on business intelligence, data warehousing and database design. He has strong customer relationship skills with over 15 of years of IT consulting to several Fortune 500 companies and proven success in leading and delivering large scale implementations with globally distributed teams.
https://prologika.com/wp-content/uploads/2016/01/logo.png00Prologika - Teo Lachevhttps://prologika.com/wp-content/uploads/2016/01/logo.pngPrologika - Teo Lachev2016-08-08 21:10:412021-02-17 01:00:37Formulating a Power BI Enterprise Strategy Seminar – Atlanta
Call/email us if you have any questions about the class. Registration closes on January 31st.
Join Teo Lachev as he presents his online Applied Power BI class. Power BI is a Microsoft cloud-hosted BI platform that opens BI to everyone without reliance on IT. And most of it is free! This class is designed for business users and data analysts. You’ll learn:
What is Power BI and why it’ll disrupt the way you analyze your business.
How to get instant insights from cloud services, such as Google Analytics, Dynamics CRM Online, Salesforce, and many others.
How to create sophisticated self-service data models whose features are on a par with models built by BI pros.
How to clean and shape dirty data.
How to create insightful interactive reports and dashboards.
How to share BI content with other users and view it on mobile devices.
No travel, no hotel expenses, just 100% content delivered right to your desktop! Our intensive online classes teach you the skills to master Microsoft BI to its fullest. Use the opportunity to ask questions and learn best practices.
Applied Power BI Training in February
NEW!Applied Power BI Online Training Class Date: February 8 – February 9, 2016 Time: Noon – 4:00 pm EDT; 9 am – 1:00 pm PDT Delivery: Online presentation with access to recorded content
https://prologika.com/wp-content/uploads/2016/01/logo.png00Prologika - Teo Lachevhttps://prologika.com/wp-content/uploads/2016/01/logo.pngPrologika - Teo Lachev2016-01-27 03:20:002016-02-20 14:31:28Improve your Power BI skills – Five days left to register!
Your 2016 resolution: bring your data to life! Don’t know where to start? I can help wherever you are! The first online run of Applied Power BI class is scheduled for early February. No travel, no hotel expenses, just 100% content delivered right to your desktop! Our intensive online classes teach you the skills to master Microsoft BI to its fullest. Use the opportunity to ask questions and learn best practices.
NEW!Applied Power BI Online Training Class Date: February 8 – February 9, 2016 Time: Noon – 4:00 pm EDT; 9 am – 1:00 pm PDT Delivery: Online presentation with access to recorded content
Power BI is a Microsoft cloud-hosted BI platform that opens BI to everyone without reliance on IT. And most of it is free! This class is designed for business users and data analysts. You’ll learn:
What is Power BI and why it’ll disrupt the way you analyze your business.
How to get instant insights from cloud services, such as Google Analytics, Dynamics CRM Online, Salesforce, and many others.
How to create sophisticated self-service data models whose features are on a par with models built by BI pros.
How to clean and shape dirty data.
How to create insightful interactive reports and dashboards.
How to share BI content with other users and view it on mobile devices.
.
https://prologika.com/wp-content/uploads/2016/01/logo.png00Prologika - Teo Lachevhttps://prologika.com/wp-content/uploads/2016/01/logo.pngPrologika - Teo Lachev2016-01-18 02:16:002021-02-16 04:59:58Online Applied Power BI Class Forming
I’m happy to announce the availability of my latest training course – Applied Power BI Service. I believe that the new version of Power BI, known as Power BI Service or Power BI 2.0, is going to be very successful and it should warrant your serious interest. This one to two-day class is designed to help you become proficient with the Power BI Service and acquire the necessary skills to work with online and on-prem data, implement data models on a par with professional models created by BI pros, unlock the power of data by creating interactive reports and dashboards, and share insights with other users. No prior data modeling or reporting knowledge is assumed. Students are welcome to bring their own data to the second day of the class.
https://prologika.com/wp-content/uploads/2016/01/logo.png00Prologika - Teo Lachevhttps://prologika.com/wp-content/uploads/2016/01/logo.pngPrologika - Teo Lachev2015-08-12 00:46:322021-02-16 02:32:32Applied Power BI Service Class Available
BI solutions typically include a semantic layer. In Microsoft BI, the role of a semantic layer is fulfilled by Multidimensional cubes or Tabular models, whose virtues I extolled in this newsletter. If you invested in an SSAS model already, congratulations! You’ve done the lion’s share. But as you know, the next step is to train your business users and get them all excited about BI. This is not a simple task. And, if you plan to use Excel to offload reporting effort, the task is even more difficult because Excel is packed with BI features. This is why I put together a recorded e-learning “Applied Excel and Analysis Services” class. Having more than 5 hours of video content, the class sells for only $120 per student. And, if you use coupon PROLOGIKA-EXCEL-1 by end of October, you can get it for only $90.
To BI managers and BI developers: You’ve implemented an organizational Analysis Service model. Now you need to choose a tool for interactive data analytics and train your users. As you know, there is a proliferation of Business Intelligence tools on the market and each claims to solve your challenges. But the chances are that you already have what you need – Microsoft Excel. And, as far as the documentation goes, who has time to document all Excel BI features and demo them to users? I designed this class to help you empower your users and get them excited about BI with Excel and Power Pivot.
To business users: If your organization have Analysis Services Multidimensional cubes or Tabular models and you want to gain valuable insights from them, then this course is for you. Designed as a step-by-step tour, this course teaches you how to become a data analyst and unlock the hidden power of data. You’ll learn how to apply the Excel desktop BI capabilities to create versatile reports and dashboards for historical and trend analysis. You’ll learn also how to share your BI artifacts across the organization by publishing them to SharePoint. “I never knew Excel can do this” is the most common feedback we hear from our students.
The class curriculum and promo video is also available on the Prologika website.
Enjoy!
https://prologika.com/wp-content/uploads/2016/01/logo.png00Prologika - Teo Lachevhttps://prologika.com/wp-content/uploads/2016/01/logo.pngPrologika - Teo Lachev2014-10-08 22:05:002021-02-16 04:58:51Applied Excel and Analysis Services e-Learning Course Available