Applied Analysis Services 2008 and PowerPivot Onsite Class

I am partnering with Data Education to deliver an intensive five-day onsite class on Analysis Services and PowerPivot. The class will be held September 19-23 at the Microsoft Technology Center in Boston. The class doesn’t assume any experience with Analysis Services. We’ll start from zero and build a multidimensional cube sharing along the way as many as best practices as possible. More information about the class and registration details is available here.

Using the IF Operator in Scope Assignments

UDM scope assignments are incredible useful because they let you write to the cube space, such as to implement custom aggregation, allocations, currency conversion, data calculations, and so on. Unfortunately, scope assignments have limitations. One of them is that more complicated scope expressions result in “an arbitrary shape of the sets is not allowed in the current context” error. Recently, I tried to use a scope assignment to zero out a cube subspace that the end user shouldn’t see and cannot be protected via dimension data security. I tried the following scope assignment (translated to Adventure Works):

Scope (

Employee.Employees.Members – Exists([Employee].[Employees].Members, <another set>, “<Measure Group Name>”),

<another attribute hierarchy>

);

this = null;

End Scope;

This produces the above error caused by employee set expression and as far as I know there is nothing you can do to rewrite the scope expression to avoid the error. In a moment of Eureka, I recall the IF operator and rewrote the scope as:

Scope (

<another attribute hierarchy>

);

IF Intersect([Employee].[
Employees].CurrentMember,

Exists([Employee].[Employees].Members, <another set>, “Measure Group Name”)

).Count = 0 THEN

this = null

END IF

End Scope;

This worked and appears that it performs well. But knowing better about scope assignments I was concerned that there might be hidden performance traps ahead. Jeffrey Wang from the Analysis Services was king enough to provide some input and even write a detailed blog about the performance implications of the IF operator. BTW, you are missing a lot if you are not following Jeffrey’s MDX and DAX blog.

As it turned out, the philosophical answer about the IF performance impact is “it depends”. Let’s say you have another scope assignment X. Instead of calculating X directly, you will be calculating something like IIF(not condition, X, NULL). So we are talking about extra overhead of an IIF function which can deliver good performance if X is in block mode. The bottom line is the server will try to apply block mode logic for IF statements. In my case, the condition would result in cell-by-cell mode but I might still get good performance if the other scope assignment (X) operates in block mode.

Although initially it appeared that there isn’t performance impact in my case, more testing revealed a severe performance hit. The cube had also scope assignments for currency conversion. These assignments interfered with the IF logic and the cube performance took a big hit. Consequently, I had to scratch out this approach.

I hope Jeffrey will write a new blog about what causes the very annoying “an arbitrary shape of the sets is not allowed in the current context” and how to avoid it if possible.

Atlanta BI Record Attendance Last Night

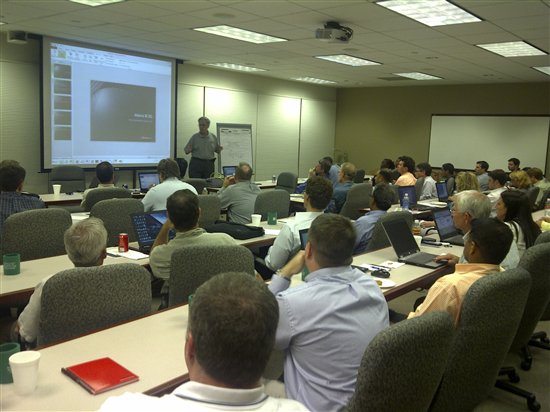
We had a blast light night at Atlanta BI and ran out of space with a record attendance of some 60+ people. This is phenomenal given that we are amidst a vacationing season. Jonathan Lacefield from Daugherty gave us a great intro presentation of Analysis Services. Michael Clifford shows cool Integration Services tips. And, Beth Lenoir from Daugherty was kind to sponsor to event and arrange for some great food. Whether it was Jonathan’s presentation, tips, or the food, the atmosphere was electrifying. Thanks to everybody for making last night a fantastic success!

4505.IMG-20110627-00036.jpg-550x0

Performance Considerations for Securing Parent-Child Dimensions

Parent-child dimensions are a very useful feature of Analysis Services to model recursive hierarchies, such as an organizational hierarchy. Recently, I had to apply dimension data security to a parent-child dimension. The allowed set expression used the factless fact table approach (see my Protect UDM with Dimension Data Security article for more details), as follows (translated to the Adventure Works schema):

IIF

— check if the user has full access

(StrToMember(“[User].[Login].&[” + Username +”]”).Properties(“FullDimensionAccess”,TYPED)=True , [Employee].[Employees].[All],

Generate

(

Exists ([Employee].[ Employee].[ Employee].Members, StrToMember(“[User].[Login].&[” + Username + “]”), “Bridge Employee Security”)

, {LinkMember (Employee.Employee.CurrentMember, Employee.Employees)}

)

)

To avoid loading the factless fact table with all dimension members for users with full dimension access, the expression checks if the user is flagged as such. Since Analysis Services doesn’t provide a way to ignore dimension data security from the allowed/denied set, the expression returns the hierarchy top member [Employee].[Employees].[All] and this is where the issue is. Returning the All member causes the server to scan recursively the entire hierarchy and perform AutoExists against all other attributes within the P-C dimensions. Unlike regular dimensions where the server can infer attribute relationships quickly, a P-C hierarchy requires dynamically checking each member. This can slow the user connect time significantly. In my case, the P-C dimension had about 300,000 members and the connect time for users with full dimension access exceeded two minutes. Needless to say, users were not happy.

There are several workarounds (none of them ideal):

  1. Move users with full dimension access to a separate role to avoid the IIF check. This wasn’t an option in our case.
  2. Remove as many attributes as possible from the P-C dimension to reduce the number of attributes for the AutoExists check.
  3. Add a new hidden P-C dimension that has the dimension key and P-C attribute. Apply dimension data security on this dimension and leave the original P-C dimension intact.
  4. Refactor the P-C dimension and move its leaf members to a new dimension in order to reduce the number of members in the P-C dimension.

I logged a new wish on connect.microsoft.com and requested the ability to ignore dimension data security. Please vote so we can have a more elegant way to address such requirements without refactoring the cube design.

Dimension Data Security and Cube Script

If you have worked with Analysis Services dimension data security for a while, you know that MDX allowed/denied set expressions can become rather complex. You might be tempted to externalize these expressions in the cube script for brevity or reusability reasons. For example, you might decide to add a calculated member that returns a list of allowed partners that the user is authorized to see over a factless fact table as follows:

CREATE MEMBER CURRENTCUBE.[Measures].[PartnerSecurityFilter] AS “Exists([Partner].[Partner].[Partner].MEMBERS, StrToMember(“”[User].[Login].&[” + Username + “]””), ‘Bridge Partner Security’; 

Then, in the allowed set you might try reusing the member definition in the allowed set expression, such as:

StrToSet([Measures].[PartnerSecurityFilter])

This sounds like a great idea but it doesn’t work. Specifically, you will find that it works for the first member of the SSAS role that connects to the server but it doesn’t work for any other members of the same role who connect to the server. To make things worst, the other users will inherit the same security access as the first user and this opens also security vulnerability.

While I am not excluding the possibility for a bug, I think what’s going here is related to the fact that the MDX script is evaluated after dimension data security is applied. What’s weird is that even dynamic expressions, such as StrToMember or StrToSet don’t work. I wasn’t able to find a workaround besides having the entire logic in the allowed/denied set expression and not referencing the cube script at all. If dimension data security becomes complicated, consider externalizing it to an Analysis Services stored procedure.

My TechEd 2011 Sessions Available Online

All TechEd 2011 breakout sessions are available online on MSDN Channel9 website. Here the links to mine:

Top 10 Reasons to Upgrade to Microsoft SQL Server 2008/R2 Reporting Services

Can Your BI Solution Scale?

Enjoy and vote!

Business Intelligence Semantic Model – TechEd Redux

While I’ve been busy at TechEd talking to BI enthusiasts, professionals and wannabes and delivering sessions, the news is out about the new BI roadmap and BISM positioning. See:

  • T.K. Anand blog
  • T.K. Anand & Ashvini Sharma recorded session What’s New in Microsoft SQL Server Code-Named “Denali” for SQL Server Analysis Services and PowerPivot”?
  • Sean Boon, Carolyn Chao, and Sabrena McBride recorded session Abundantly “Crescent”: Demos Galore
  • Julie Strauss’ recorded session The Next Generation Design Tools for Analysis Services
  • And the feedback from the community insiders, including Chris Webb’s Good News on the Future of Analysis Services blog, Marco Russo’s Microsoft Updates its BI Roadmap blog, and Boyan Penev’s SSAS to BISM – Recent Developments blog.

So, I won’t repeat what’s been already said. Instead, I’ll attempt to summarize my thoughts about the new BI developments and give you some take-home points to help you plan future BI work.

  • I spent many hours with the SSAS and SSRS product groups at TechEd. I liked what I saw. I saw the SSRS and SSAS teams working together. I saw the impressive visualization capabilities of the sleek Crescent tool which will give the competition a run for their money. And I saw the future of Analysis Services and Microsoft BI platform – the new BISM model that is positioned to become what UDM promised to be.
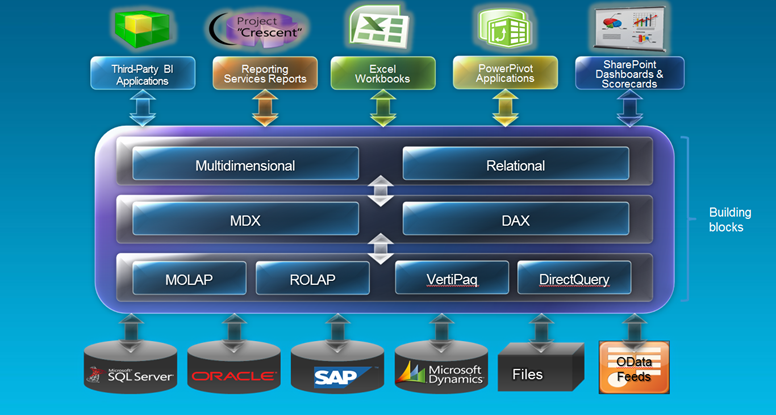
  • BISM is now the unifying name for both the Multidimensional (OLAP) and Tabular or Relational (in-memory) models. Both models will support MDX and DAX query options. Consequently, Excel can see a tabular model as a cube and query it with MDX, while Crescent will be able to see an OLAP cube as a tabular model and send DAX queries to it. This is awesome news that warrants retreating the Ugly part from my blog Business Intelligence Semantic Model – The Good, The Bad, and the Ugly. Kudos to Microsoft for listening to the community and kudos to MVPs for providing relentless feedback!
  • Make no mistake though. Although the external interfaces are the same and there is a significant feature overlap, in Denali the two models will not compatible with each other and no migration path will be provided, e.g. OLAP to Tabular or vice versa. An analogy might be helpful here. Think of Microsoft Access and SQL Server relational databases. Both of them are databases, both support SQL, and both have similar features (tables, relationships, etc.). We could use the label “Relational Database Model” as a unifying name for both databases although each path leads to a completely different model. So, why we are implying a unification here? Think of BISM as a prediction of the future. In time, Tabular may “borrow” OLAP features, such as MDX scripts and OLAP may get Tabular’s elements, such as in-memory partitions. Thus, the divide between the models might blur to a point where the two paths converge into a single model.
  • The most important thing to remember is that the Tabular model is not a replacement for OLAP cubes. Anybody and I repeat anybody, who claims the opposite should be brought to justice and tried in the BI Court. T.K. Anand from the Microsoft SSAS team has actually a faster procedure of strangling that person with his bare hands. You should see Tabular as completing and not competing technology to OLAP, a technology that opens interesting possibilities that were not previously possible with OLAP alone.
  • Regardless of naming and marketing, the question in everybody’s mind moving to Denali would be which path and model to choose for new projects. And, here is my simplified personal plan based on the type of the BI project at hand:

    Self-service BI – This is a no-brainer – PowerPivot and Excel. If you want to let business users analyze data on their own, look no further than Excel.

    Team BI – How do business users share PowerPivot models with other users? SharePoint and PowerPivot of course. Another no-brainer.

    Corporate BI – This is where things get trickier. Let’s go through a few scenarios:

  1. If you’ve started on the PowerPivot path but have exceeded the PowerPivot capabilities, e.g. you need more data (above 2GB) or row-level security, then a PowerPivot model migrated to Analysis Services running in a VertiPaq mode will be a logical choice. This will give you a nice continuum of self-service BI – Corporate BI on a single platform.
  2. If all you need is a simple model that wraps a layer over a raw database or warehouse for reporting & analytics and you don’t have experience with OLAP, consider a tabular model and DAX because of its lower learning curve and less rigid data schema requirements. The issue I have with the “simple” model is that based on my experience many projects start simple but grow exponentially in complexity over time. A many-to-many relationship may creep in, as well as time calculations, currency conversion, etc. So, be careful here, evaluate requirements (if you have them) and take your time to weigh out features and prototype because switching from one model to another will require a complete rewrite. Continuing the Relational Database analogy above, it will feel like moving from Access to SQL Server and you won’t have a wizard. Denali Tabular won’t support OLAP features that we grew to love, such as declarative parent-child and many-to-many relationships (it does support them via DAX calculations but you’ll end up with a calculated measure for each numeric column as in the SSAS 2000 days), scope assignments for implementing time calculations, allocations and currency conversion, Excel what-if analysis, default members, named sets, and others. Although easy to start with, DAX calculations can become complex to a point where you might wonder what you are really saving by switching from MDX to DAX if you are after avoiding the MDX learning curve.
  3. Enterprise-wide BI and Data Warehousing – Here, I’d stick with multidimensional OLAP cubes for now. I won’t bet complex and high-visibility projects on Tabular, at least not for Denali. First, more than likely such projects will require the features I mentioned above. Second, I’d give Tabular some time to marinate in the corporate space. Finally, in Denali only Crescent will support Tabular natively via DAX. In comparison, there are many clients that are optimized to support MDX and OLAP cubes.

I’d like to indulge myself and think that one day, I hope in not so distant future, BISM will evolve to become a true single model that delivers on the UDM promise and combines the best of OLAP and Tabular. Then, we would be able to pick and mix features from both OLAP and in-memory paths, e.g. an in-memory storage with MDX calculations, and use the best technology for the task at hand. Until then, we will have to choose between the multidimensional and tabular paths.

052011_0128_BusinessInt1

TechEd Session Downloads

The slides and source code for my TechEd 2011 North America session are available for download on the Prologika website (requires registration). If you haven’t registered, please click the Join link in the upper right corner. My breakout sessions are:

DBI205 – Top 10 Reasons to Upgrade to Microsoft SQL Server 2008/R2 Reporting Services
Rich in demos, this session presents top reasons to upgrade to Microsoft SQL Server 2008 and SQL Server 2008 R2 versions of Reporting Services. Use this information to convince your boss that it’s time to upgrade and remove past limitations. If you already use these versions, you might discover features that can help you find ways to simplify report authoring and maintenance.

DBI330 – Can Your BI Solution Scale?
Your Business Intelligence solution is ready for prime-time but will it perform well? Join this session to learn techniques for testing the performance and scalability of Microsoft SQL Server Reporting Services (SSRS) and Microsoft SQL Server Analysis Services (SSAS).

TechEd 2011 Keynote

Watching the TechEd keynote during which it was announced that we have some 10,000 people attending TechEd this year. On the BI side of things, Amir Netz, Distinguished Engineer at Microsoft, came on stage to unveil some of the new features coming up in Denali and demonstrate the BI continuum story in Denali (PowerPivot, SharePoint with Crescent reporting, and Corporate BI). The Corporate BI model had some 2 billion rows cached in-memory VertiPaq engine. You will be able to use Visual Studio to “take over” from Excel and build models exceeding the Excel limitation of 2GB file size. Wait for more exciting news tomorrow at sessions DBI206 – What’s New in Microsoft SQL Server Code-Named “Denali” for SQL Server Analysis Services and PowerPivot and DBI211 – What’s New in Microsoft SQL Server Code-Named “Denali” for Reporting Services!


On the Windows Phone area, interesting news was that there will be an upgrade later on this year that would let mobile users integrated with Office365 and Lync Mobile. Unfortunately, no news to make BI available to Windows 7 phones yet.

Where is Teo at TechEd 2011?

My TechEd sessions got finalized. This would be my sixth TechEd to go to and present at (this one conveniently located in my home city). This time I am honored to have three sessions (two breakout sessions and one interactive session). You can’t attend, you should be able to find me hanging around at the DBI booth.

CodeSessionDayTime
DBI205Top 10 Reasons to Upgrade to Microsoft SQL Server 2008/R2 Reporting Services

Breakout Session

Primary Speaker(s): Teo Lachev

Proposed Speaker(s:)

Rich in demos, this session presents top reasons to upgrade to Microsoft SQL Server 2008 and SQL Server 2008 R2 versions of Reporting Services. Use this information to convince your boss that it’s time to upgrade and remove past limitations. If you already use these versions, you might discover features that can help you find ways to simplify report authoring and maintenance.

Monday, May 163:00 PM – 4:15 PM
DBI330Can Your BI Solution Scale?

Breakout Session

Primary Speaker(s): Teo Lachev

Proposed Speaker(s:)

Your Business Intelligence solution is ready for prime-time but will it perform well? Join this session to learn techniques for testing the performance and scalability of Microsoft SQL Server Reporting Services (SSRS) and Microsoft SQL Server Analysis Services (SSAS).

Monday, May 164:45 PM – 6:00 PM
DBI378-INTMicrosoft SQL Server Reporting Services Tips and Tricks, How-to and Beyond

Interactive Discussion

Primary Speaker(s): Teo Lachev

Speaker Assistant(s):

Proposed Speaker(s:)

Join this session to understand how Reporting Services 2008 and R2 can help you find solutions and workarounds for some of the features you requested the most. Learn report authoring and management tips and tricks that will help you bring your investment to the next level.

Thursday, May 192:45 PM – 4:00 PM
UPDATE 5/12/2011

Here are my DBI booth staffing times where I will be awaiting your BI questions:

Monday – 5:30 PM-7:30 PM

Tuesday – 12:30 PM-3:30 PM

Wednesday – 3:00 PM-5:00 PM