DAXMD Goes Public!

Microsoft announced yesterday the availability of the Community Technology Preview (CTP) of Microsoft SQL Server 2012 With Power View for Multidimensional Models (aka DAXMD). As a participant of the CTP program and I’m very excited about this enhancement. Now customers can leverage their investment in OLAP and empower business users to author Power View ad-hoc reports and dashboards from Analysis Services cubes. Previously, Power View supported only PowerPivot workbooks or Analysis Services Tabular models as data sources. I’m not going to repeat what T.K. Anand said in the announcement. Instead, I want to emphasize a few key points:

  1. This CTP applies only to the SharePoint-version of Power View. Excel 2013 customers need to wait for another release vehicle to be able to connect Power View in Excel 2013 to cubes.
  2. You’ll need to upgrade both the SharePoint server and SSAS server because enhancements were made in both Power View and SSAS.
  3. Although not supported, I successfully tested that you can install the CTP on top of SQL Server 2012 SP1.
  4. The CTP will not be upgradable to RTM.
  5. It’s not known at this point when and how the RTM bits will ship.
  6. DAXMD doesn’t translate DAX queries to MDX. Instead, the DAX queries are handled natively on the server and performance is awesome!

Kudos to the SSAS and SSRS teams for listening to customers and working together on this feature!

Atlanta BI Group Meeting on Monday, December 3rd

I’ll be presenting What’s New in Excel 2013 and SharePoint 2013 BI at our Atlanta BI Group on Monday, December 3rd.

Microsoft has recently released the 2013 version of Excel and SharePoint. Both technologies include major enhancements for self-service and organizational BI. Join us to review these new features. Learn how business users can quickly analyze and understand data in Power Pivot which is now natively supported by Excel. See how Power View enables rich data visualization and having fun with data both on the desktop and server. Understand the new Excel and SharePoint features for organizational BI that opens new opportunities for analyzing OLAP and Tabular models.

Geocoding with Power View Maps

As I wrote before, Power View in Excel 2013 and SharePoint with SQL Server 2012 SP1 supports mapping. The map region supports geocoding and it allows you to plot addresses, countries, states, etc, or pairs of latitude-longitude coordinates. The key for getting this to work is to mark the columns with appropriate categories.

  1. Using latitude-longitude

If you have a SQL Server table with a Geography data type, you can extract the latitude and longitude as separate columns.

SELECT SpatialLocation.Lat, SpatialLocation.Long FROM Person.Address

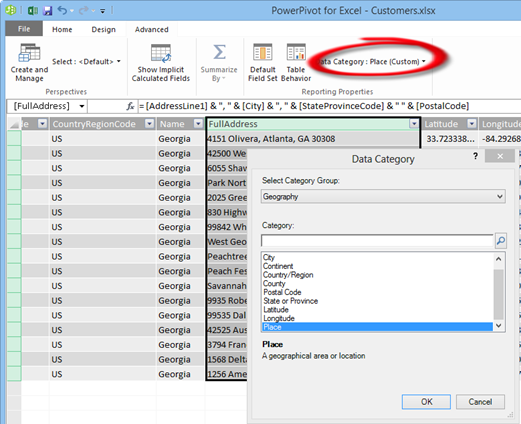
Once you import the dataset in PowerPivot, make sure to categorize the columns using the Advanced tab.

112912_1308_Geocodingwi1

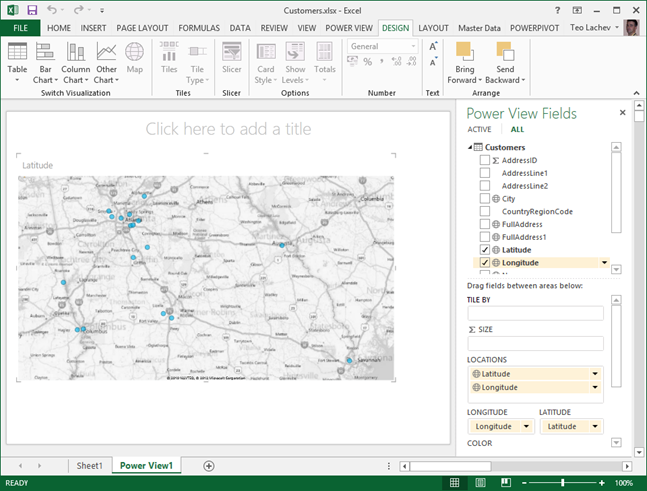
The map region doesn’t support grouping on latitude-longitude so you can’t just place them in the Latitude-Longitude zones and expect it work. Instead, you have to add another field, such as address or both the Latitude-Longitude combination to the Location field. The map groups on the Location zone but uses the Latitude and Longitude to place the points.

112912_1308_Geocodingwi2


  1. Address geocoding


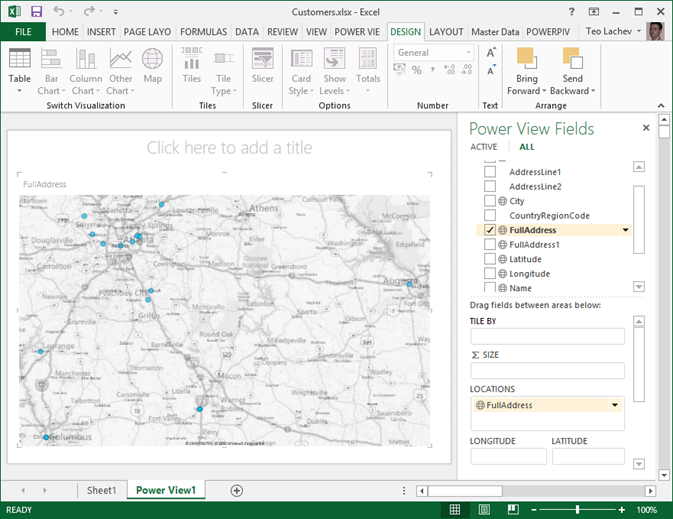
    If you don’t have Latitude-Longitude, the map is capable of geocoding full addresses. Again, the trick here is to categorize the FullAddress column as Address. However, if you have invalid addresses, you’ll find that the map won’t show them. Instead, categorize the column as Place, which you can find in the More Categories section (thanks to Sean Boon from the Reporting Services team for the tip).


    112912_1308_Geocodingwi3


    The map passes to Bing the fact that the field is mapped as Address so it should plot whatever we get back from Bing. The Bing Maps web experience isn’t identical to the API as you can’t pass the Address hint to Bing in the web experience. The Place category is more liberal in terms of what it will attempt to plot.


    112912_1308_Geocodingwi4

Book Review “Microsoft SQL Server 2012 Analysis Services – The BISM Tabular Model”

I’ve recently had the pleasure to read the book “Microsoft SQL Server 2012 Analysis Services – The BISM Tabular Model” by Marco Russo, Alberto Ferrari, and Chris Webb. The authors don’t need an introduction and their names should be familiar to any BI practitioner. They are all well-known experts and fellow SQL Server MVPs who got together again to write another bestseller after their previous work “Expert Cube Development with Microsoft SQL Server 2008 Analysis Services”. The latest book was published about five months after my book “Applied Microsoft SQL Server 2012 Analysis Services: Tabular Modeling”. Although both books are on the same topic, we didn’t exchange notes when starting on the book projects. In fact, I was well into writing mine when I learned on the SSAS insider’s discussion list about the trio’s new project. Naturally, you might think that the books compete with each other but after reading Microsoft SQL Server 2012 Analysis Services – The BISM Tabular Model” I agree with Marco and Chris that the books actually complement each other pretty well.

A central theme of my book is the continuum of Self-service, Team, and Organizational BI. I felt that it is very important to show how Tabular addresses the needs of both business users and BI pros. Indeed, the Tabular journey can start very unassuming, perhaps with a business user creating a simple personal model, gains popularity and evolves to a deployed model shared by teammates, and finally to a corporate model that is provisioned and sanctioned by IT. Because of this, the first part of the book covers PowerPivot for Excel, the second covers PowerPivot for SharePoint, and the third part covers Analysis Services Tabular. Since my book naturally targets different reader audiences (business users, power BI users, and BI pros), I felt that it was imperative to lower the learning curve as much as possible, such as providing step-by-step instructions for the exercises and video tutorials. Writing a book that targets such a broad base is not easy. To make sure that the book will be well accepted, I had readers who represented each of these groups review the manuscript and provide feedback.

On the other hand, Microsoft SQL Server 2012 Analysis Services – The BISM Tabular Model focuses on the professional side of Analysis Services Tabular and targets mainly BI pros. More than half of the book is devoted on DAX and you’ll be hard pressed to find a better coverage on this topic (a note to myself that DAX deserves more attention if I ever write a revision). Besides DAX, Microsoft SQL Server 2012 Analysis Services – The BISM Tabular Model covers equally well other aspects of Tabular and the author’s real life experience shows through. My favorite chapters are Chapter 11 “Data Modeling in Tabular” and Chapter 12 “Using Advanced Tabular Relationships”.

All in all, any serious BI pro willing to learn Tabular should have this book on the shelf… I hope next to mine.

SQL PASS 2012 Day 1 Announcements

I hope you watched the SQL PASS 2012 Day 1 Keynote live. There were important announcements and I was sure happy to see BI being heavily represented. For me, the most important ones were:

  1. The availability of SQL Server 2012 Service Pack 1

For some reason, this announcement went without being applauded from the audience although in my opinion it was the most important news from the tangible deliverables. First, I know that many companies follow the conventional wisdom and wait for the first service pack before deploying a new product. Now the wait is over and I expect mass adoption of SQL Server 2012. At Prologika, we’ve been using SQL Server 2012 successfully since it was in beta and I wholeheartedly recommend it. Second, SP1 is a prerequisite for configuring BI in SharePoint 2013, as I explained previously. Indeed, I downloaded and run the setup and I was able to continue the SharePoint 2013 PowerPivot configuration. BTW, the build number of SP1 is 11.0.2100.60.

Note If you’re configuring PowerPivot for SharePoint 2013, you must also install a PowerPivot for SharePoint 2013 add-in (there is a new installer package called spPowerpivot.msi) in order to get the upgraded version of the PowerPivot Configuration Tool for SharePoint 2013. If you open the RTM version of the PowerPivot Configuration Tool for SharePoint, it will promptly complain that it doesn’t know a thing about SharePoint 2013 and redirect you to this page. Unfortunately, at this time, the link on this page points to the Community Technology Preview of the SQL Server 2012 SP1 Feature Pack and the whereabouts of the official SP1 release of the feature pack are not known (the Feature Pack was published with an incomplete list of files). I downloaded and ran the CTP version of and then ran the PowerPivot Configuration Tool for SharePoint 2013. It appears that the CTP version did a respectable job and all it was capable of successfully configuring PowerPivot for SharePoint. However, please wait for the official release of the SQL Server 2012 Feature Pack to avoid issues.

  1. Power View for Multidimensional – OK, the cat is out of the bag on this one and Amir showed a demo. As a participant of the CTP program Power View for Multidimensional, I’m very happy about it. That’s all I can say at this point while waiting for the public technology preview. Unfortunately, Power View for Multidimensional didn’t make it to SP1 and it’s not known at this point when and how it will ship. But if you have multidimensional cubes (and who doesn’t) the wait will be worthwhile I promise.
  2. Updatable Columnstore Indexes in SQL SERVER.NEXT – This a good news for users of columnstore indexes that will avoid dropping and recreating the indexes. This will be especially useful for columnstore indexes built on top of large fact tables, such as in the scenario I described here.
  3. Hekaton – Plans to ship a long-due in-memory OLTP technology in SQL Server.NEXT.
  4. Polybase – Another new technology slated for the next release of SQL Server 2012 Parallel Data Warehouse (expected in first half of 2013) that will allow you to run T-SQL queries joining relational data residing in PDW and Hadoop data. I guess this is the materialization of the David DeWitt’s Enterprise Data Manager idea that he talked about in his 2011 PASS presentation. I’m looking forward to his sequel which I suppose will go in details on this topic. Did we run out of cool names from the animal kingdom to succeed Hadoop, Mahoot, Pig, etc? I guess will find out in David’s talk.

Here is the list of the forthcoming live sessions.


UPDATE 11/8/2012

Here is a direct link to the release build of the PowerPivot Configuration Tool for SQL Server 2012 SP1.

Installing HDInsight Server for Windows

As you’ve probably heard the news, Microsoft rebranded their Big Data offerings as HDInsight that currently encompasses two key services:

  • Windows Azure HDInsight Service (formerly known as Hadoop-based Services on Windows Azure) – This is a cloud-based Hadoop distribution hosted on Windows Azure.
  • Microsoft HDInsight Server for Windows – A Windows-based Hadoop distribution that offers two main benefits for Big Data customers:
    • An officially supported Hadoop distribution on Windows server – Previously, you can set up Hadoop on Windows as an unsupported installation (via Cygwin) for development purposes. What this means for you is that you can now set up a Hadoop cluster on servers running Windows Server OS.
    • Extends the reach of the Hadoop ecosystem to .NET developers and allows them to write MapReduce jobs in .NET code, such as C#.

Both services are available as preview offerings and changes are expected as they evolve. The Installing the Developer Preview of Apache Hadoop-based services on Windows article covers the setup steps pretty well. I decided to set up HDInsight Server for Windows by installing the Microsoft Web Platform Installer on my Windows 8 laptop.

Note Initially, I planned to install HDInsight Server for Windows on a VM running Windows Server 2012 Standard Edition. Although the installer completed successfully, it failed to create the sites and shortcuts to the dashboards (Hadoop Name Node, Dashboard, and MapRaduce). This was probably caused by the fact that server was configured as a domain controller. There is an ongoing discussion about this issue on the Microsoft HDInsight forum.

The Windows 8 setup failed to create the shortcut to the dashboard. However, the following steps fixed the issue:

1. Open up an Administrator PowerShell prompt and elevate the execution policy of the PowerShell to accept scripts.

PS:> Set-ExecutionPolicy RemoteSigned

2. Navigate to the C:\HadoopFeaturePackSetup\HadoopFeaturePackSetupTools folder:

cd C:\HadoopFeaturePackSetup\HadoopFeaturePackSetupTools

  • Install HadoopWebApi

.\winpkg.ps1 ..\Packages\HadoopWebApi-winpkg.zip install -CredentialFilePath c:\Hadoop\Singlenodecreds.xml

  • Install the dashboard

.\winpkg.ps1 ..\Packages\HadoopDashboard-winpkg.zip install -CredentialFilePath c:\Hadoop\Singlenodecreds.xml

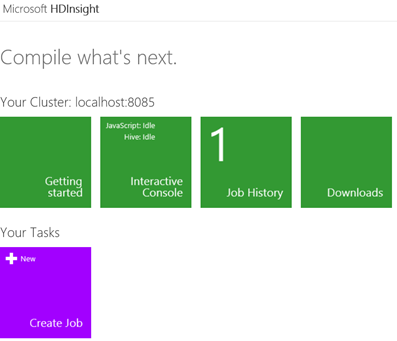
This should create the shortcuts on the desktop and you should be able to navigate to http://localhost:8085 to access the dashboard.

110112_0205_InstallingH1

From here, you can open the Interactive Console and your experience should be the same as Windows Azure HDInsight Service. David Zhang has a great coverage of how you can use the Interactive Console in his video presentation “Introduction to the Hadoop on Azure Interactive JavaScript Console”.

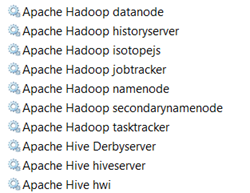
BTW, HDInsight Server installs a set of Windows services corresponding to the UNIX daemons when Hadoop is installed on UNIX.

110112_0205_InstallingH2