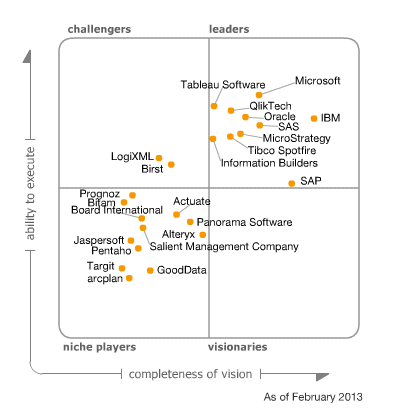
MVP fellow, Andrew Burst, discusses Gartner’s newly released DW (not BI, mind you) magic quadrant. It looks like Gartner fell in love with Teradata but Microsoft is moving up as well thanks to the advances in its Parallel Data Warehouse (PDW) and in-memory offerings.
I ran into a severe performance issue with the Aggregate function and unrelated dimensions which I reported on connect. In this context, an unrelated dimension is a dimension that doesn’t join any measure group in the cube. Why have unrelated dimensions? My preferred way to implement time calculations is use a regular dimension that is added to the cube but not related to any measure groups. Then, I use scope assignments to overwrite the time calculations, e.g. for YTD, MTD, etc. For example, the scope assignment for YTD might look like:
Notice the use of the Aggregate function which when executed maps to the default aggregation function of the underlying measure. For some reason with SQL Server 2012, a query that uses the Relative Date dimension experiences a significant performance hit. Replacing Aggregate with Sum fixes the issue, assuming you can sum up the affected measure to produce the time calculations.
https://prologika.com/wp-content/uploads/2016/01/logo.png00Prologika - Teo Lachevhttps://prologika.com/wp-content/uploads/2016/01/logo.pngPrologika - Teo Lachev2013-02-05 13:55:462016-02-16 04:57:16Performance Degradation with the Aggregate Function and Unrelated Dimensions
What options does a PowerPivot user have to refresh data in a PowerPivot model on the desktop, aka PowerPivot for Excel?
Prior to Excel 2013, the answer was just one – manual refresh by either clicking the Refresh button in the PowerPivot window or the Refresh button in the Existing Connections dialog box. Note that the Refresh button in the Excel ribbon doesn’t work since Excel doesn’t know anything about PowerPivot. Not does the checking the “Refresh data when opening the file” checkbox in the PowerPivot connection. In Excel 2010, these options won’t reopen the PowerPivot connections to the data sources. Instead, the net effect is that they will simply refresh the pivot reports from the pivot cache which is not what you’re after.
Starting with Excel 2013, however, Excel and PowerPivot play better together as I discussed in my What’s New in Office 2013 BI blog. And, now we have additional options to refresh data:
Right-click the pivot report, go to PivotTable Options, click the Data tab, and then click “Refresh data when opening the file”. Enabling this option will refresh the data in the PowerPivot tables that are used on the report when you re-open the Excel workbook file.
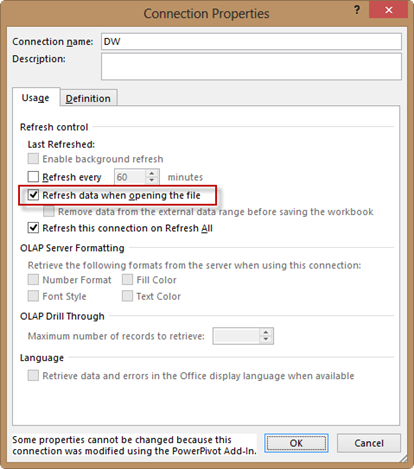
In the Excel Data ribbon, click Connections, select the connection you want to refresh, and then click Properties. Notice that all PowerPivot connections are now exposed in the Connections dialog. In the Connections Properties dialog box, check the “Refresh data when opening the file”. This option will open the connection when you open the file, and refresh all PowerPivot tables using the connection.
3. Finally, you can also automate PowerPivot tasks, including refreshing data. For example, if you want to refresh the ResellerSales table on open, you can add the following line to the Workbook_Open() event:
Speaking of automation, everything you can do in the Excel UI is exposed in the object model and automatable in Excel 2013. Here is another example of adding a table from the Excel workbook to the model and then creating a relationship between that table and another table which is already in the model:
Besides the usual hassle configuring PerformancePoint, including insufficient permissions to databases and service accounts, version 2013 requires the SQL Server 2008 R2 drivers. This is surprising considering that SharePoint 2013 shipped after SQL Server 2012.
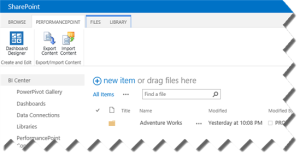
In a previous blog, I explained how to configure the SharePoint 2013 BI Center. When you go to any of the PerformancePoint-related links, such as Dashboards or PerformancePoint Content, you’ll see the following ribbon.
The Dashboard Designer button is the new way to launch the PerformancePoint Designer. However, when you attempt to configure a data source pointing to Analysis Services, you will likely get an error. The first stop for troubleshooting SharePoint and PerformancePoint issues is of course the Windows Event Log. If you examine the Windows Event Log, you’ll see that PerformancePoint fails to load the 10.0 version of Microsoft.AnalysisServices.AdomdClient. This is the version that’s included in SQL Server 2008 R2. This sends you to the SQL Server 2008 R2 Feature Pack page, from where you can download and install the Microsoft SQL Server 2008 R2 ADOMD.NET library. Now, you can connect to Analysis Services.
The next trip to the SQL Server 2008 R2 Feature Pack page will happen when you try to import (not create) KPIs defined in an Analysis Services cube. This time the error in the Event Log indicates that PerformancePoint requires the 10.0 version of the Microsoft.AnalysisServices dll, which represents the Analysis Services Management Objects (AMO). Back to the SQL Server 2008 R2 Feature Pack, you need to download and install Microsoft SQL Server 2008 R2 Analysis Management Objects. While you there, you might as well download and install Microsoft Analysis Services OLE DB Provider for Microsoft SQL Server 2008 R2 although I don’t think PerformancePoint uses it.
Where should I put my BI reports? Should I upload them to department-level SharePoint sites or put them in one place?
These are common questions that we get from customers. Delivering on the promise of pervasive BI, my preference is to centralize BI artifacts in a single place. Ideally, this BI depository should be the SharePoint Business Intelligence Center. If organizational security is required, you can control security at SharePoint site or library level. For example, you can create department-specific PowerPivot galleries.
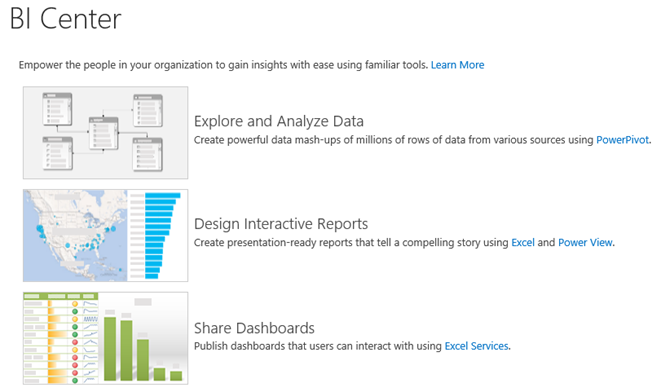
The BI Center is one of the SharePoint site templates that is specifically designed to host BI reports. In SharePoint 2013, Microsoft has extended the BI Center to accommodate various types of BI documents.
When I first installed the BI Center in SharePoint 2013 (click Settings (the wheel in the top-right corner), Site Contents, New Subsite, Enterprise Tab, Business Intelligence Center), I was confused. The images are not clickable and the default home page doesn’t offer much more. It turned out that by default, the BI Center doesn’t add a navigation menu. To fix this:
Navigate to the BI Center, navigate to the BI center link.
Click Settings, Site Settings, and click the Navigation link (under the Look and Feel section).
In the Current Navigation section, select the Structural Navigation option.
In the Structural Navigation Sorting section, click Add Heading to add a new menu item for each library your users want to navigate to. To get the links, back to the BI Center, go to Settings, Site Contents, and then right-click the library you are interested in, such as Dashboards, and click Copy Shortcut. Then, paste the shortcut in the URL field in the Navigation Heading dialog box.
This is what the resulting navigation pane might look like. One thing that might not be obvious is that the added benefit of creating your links using the SharePoint structural navigation is that links reflect security. For example, if the user doesn’t have permission to a library, the user won’t see the link. Note that there might be additional steps required, such as to enable the library content types, as with SharePoint 2010.
https://prologika.com/wp-content/uploads/2016/01/logo.png00Prologika - Teo Lachevhttps://prologika.com/wp-content/uploads/2016/01/logo.pngPrologika - Teo Lachev2013-02-04 01:23:002016-02-16 05:57:42The SharePoint 2013 Business Intelligence Center