Solving Datazen MDX Query Limitations

As I mentioned in a previous blog, Microsoft added Datazen to its arsenal of data visualization tools. Datazen, of course, comes with its own pros and cons. In this blog, you’ll see how you can get around a Datazen limitation when connected to an SSAS data model.

Scenario: You create a Datazen dashboard that sources data from an SSAS MD or Tabular model. As usual, you need a query that slices some measures by dimension attributes, such as the query below:

select {[Measures].[Sales Amount],[Measures].[Order Quantity]} on 0,

[Product].[Category].[Category].Members
on 1

from [Adventure Works] 

While this query works fine in SSRS, when Datazen runs the query it silently drops the dimension attributes from the result. You might attempt to rewrite the query as follows:

select [Product].[Category].[Category].Members * {[Measures].[Sales Amount],[Measures].[Order Quantity]} on 0

from [Adventure Works]

But then you get:

The query cannot be prepared. The query must have at least one axis. The first axis of the query should not have multiple hierarchies, nor should it reference any dimension other than the Measures dimension…        

Solution: The problem is that Datazen doesn’t support dimension attributes in the query resultset. This limitation is overly restrictive but there is a workaround by changing the query to return the desired dimension attributes as calculated members:

with
member CategoryName as
iif ([Measures].[Sales Amount]=0, null, [Product].[Category].CurrentMember.Member_Caption)

select {CategoryName, [Measures].[Sales Amount],[Measures].[Order Quantity]} on 0,

[Product].[Category].[Category].Members
on 1

from [Adventure Works]

Notice that the calculated member uses the Iif operator to check if a product category has data so that the query doesn’t return all categories whether they have data or not.

UPDATE 7/23/2015

Microsoft released an update that fixes this limitation. Now when you go through the wizard, there is a step that allows you to select which dimension properties you want in the results.

Power BI Custom Visuals Announced

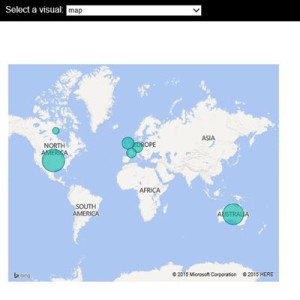
Today Microsoft announced the general availability of Power BI on July 24th meaning that Power BI goes live on that date. Among the many new features mentioned in the blog, the one that piqued my interest is custom visuals. Developers might recall that SSRS has provided custom report items since version 2005, which I wrote about in the October 2006 issue of the MSDN Magazine. Similarly, now you can implement custom visualizations in Power BI! And, instead of writing .NET code, you can do so using JavaScript. This opens the path to implement custom visuals using any of the JavaScript-based visualization frameworks, such as D3, WebGL, Canvas, or SVG.

This will be huge as it will allow developers to extend the Power BI visualization capabilities using open-source visualization frameworks. Do you need some gadgets, like a bullet graph? With some coding wizardry, you can implement your own, such as by using the D3 Bullet Charts sample. Moreover, to speed up development, Microsoft has published the code of all of the existing Power BI visualizations on GitHub. Once you follow the instructions to install the Power BI Visuals Sample, you can open the project in Visual Studio and open in the browser index.html located in the PowerBIVisualsPlayground project. This allow you to test the visuals. The actual TypeScript code of the Microsoft visualizations is located in the Visuals project.
3833.custommap.jpg-400x0I think the Microsoft decision to make Power BI open will be a paradigm shift for the BI industry. Besides the Push API which are already published, Microsoft has already indicated plans to make Power BI even more open, such as to allow developers to embed reports in custom web applications. Now, if only Power BI supports on-prem installation …
Azure Data Catalog Announced

Microsoft just announced the public preview of Azure Data Catalog, previously known as “Project Tokyo”. I had a chance to take an early review of Azure Data Catalog to help a big organization which was interested in simplifying discoverability and access to data across the enterprise. As I mentioned in my “QUO VADIS DATA WAREHOUSE?” newsletter, logical data warehousing (LDW) has gained some traction and backing from vendors, including Composite (acquired by Cisco), Denado, and others.

“Logical data warehousing is at a very early stage of adoption. In my opinion, the companies that will benefit most of it are large organizations with many data repositories, where data availability is a major barrier for enabling self-service BI. If you believe that your organization might benefit from a Logical Data Warehouse, you might not need to make a major investment. If your organization has an Office 365 Power BI subscription, your first step could be leveraging the Power Query capabilities for dataset sharing and discovery. This process can work like this:

  1. Designated users promote virtual views in the form of Power Query queries to Office 365.
  2. A data steward verifies and approves these datasets.
  3. Once signed in to Office 365, other users can search, preview these queries, and import the associated data in self-service BI models.”

 You can view Azure Data Catalog is the Microsoft attempt to enter the logical data warehousing market. It also can be viewed as the next step of Power Query Dataset Sharing, now available as a standalone cloud service with new features. It’s all about providing and discovering the necessary metadata that describers the most valuable asset: your data. I welcome Azure Data Catalog but to make it more appealing to large organizations, which will be the most likely customers interested in it, I shared the following feedback with Microsoft:

  1. Support more data sources, as it stands Azure Data Catalog is limited to SQL Server as RDBMS. It’s paramount to support initially at least the most popular ones, including Oracle, DB2, Hadoop, SalesForce, etc. In fact, I don’t see why we can support all Power Query-supported data sources if we route the data acquisition through Power Query.
  2. Support for ODATA so that not only end users but applications can easily consume these shared datasets.
  3. Support for in-memory dataset caching to allow the administrator to configure the datasets to cache results on the server. This could be conceptually similar to SSRS shared dataset caching. Caching would allow us to avoid hitting underlying databases for slow queries.
  4. On-premise support – Cloud is great but it might be a hassle for a large organization to embrace the cloud if they haven’t done this already. Just extending their AD to the cloud would need to pass a lot of red tape.

Except this video, there isn’t much public information currently about Azure Data Catalog but that will probably change next week when Microsoft announces it officially.

What’s New for BI in Office 2016?

While you might be trying to convince management to upgrade to Office 2013, the next version of Microsoft Office (Office 2016) is on the horizon and scheduled to be released sometime in the Fall. Meanwhile, you can download and test the Public Preview. Naturally, you might wonder what’s new for BI given that Excel is the Microsoft premium BI desktop tool. In my newsletter, I’m sharing my favorite Excel 2016 BI features (most significant listed first).

Disaster Recovering

Over the last couple of weeks, I learned a thing or two about disaster recovery. My server crashed and it had to be replaced. While we were able to get Prologika.com up and running quickly, the community site was down for a while. I am happy to report that while there are some kinks remaining, for the most part the community site has been restored.

Cool Visualizations Coming To You This Summer

I welcome every news about better visualizations in Microsoft BI so I rejoiced to read this blog by Ariel Netz, Group Program Manager in the Power BI Designer team.

“The Power BI Designer team is working on our first update for the summer. That update will be significant, and will signal a new phase in our product development. To date we have mostly invested in the modeling and query capabilities, but starting with the first summer release users will see heavy investments in the Data Exploration & Reporting capabilities in the product. While it might be bit premature to go into detail, it’s not premature to provide a teaser… ”

And the teaser screenshot in the blog shows more visualization gadgets with the ability to change chart series colors. I hope they thrown in conditional formatting as well.

Confused which visualization tool to use? You probably are with so many vendors and tools out there. But as I said many times, your focus should be on data integration and not on the front end. If you have a solid architecture and trusted data, it should be easy to plug in whatever visualization tool is the course de jour. Yesterday it might have been QlikView, today Tableau might enjoy the spotlight, but tomorrow it might very well be the Power BI Designer.

May you leave in interesting times – Chinese proverb.

Where Are My Storage Pool Disks?

I’ve been doing quite a bit of SQL Server performance work lately, helping customers embrace the cloud. One great feature of Windows Server 2012 and above is the ability to implement a storage pool combining multiple disks. This greatly simplifies disk striping to distribute I/O and deprecates RAID configurations, as explained in more details in the “Performance Guidance for SQL Server in Windows Azure Virtual Machines” whitepaper from Microsoft.

In this case, the client has an A7 Azure VM which allows attaching up to four 1TB data disks. Another great Azure feature is that you only pay for what you use. What it means to you is that you cut cost because you have all of this storage available but you are charged only for the actual storage and not for the capacity.

In the process of configuring the storage pool, you might find that none or some of the disks show up preventing you from creating a new storage pool although you’ve attached them all right and they are there. How do you fix this horrible issue? Delete the disk partitions (also known as volumes). That’s because you can only create a storage pool of uninitialized disks only.

  1. Right Windows Disk Management.
  2. Right-click on each disk and click Delete Volume.

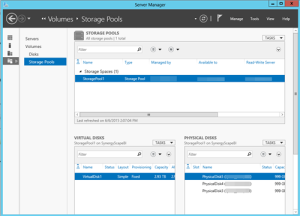
Now you can create your storage pool. In this case, I’ve created one virtual disk that has three physical disks for a total combined storage of 3 TB.


0246.2015-06-06_17-07-15.png-500x0

What’s New for BI in SQL Server 2016 CTP2?

The first public preview of SQL Server 2016 (CTP2) got announced yesterday. The natural question for BI pros is what’s new for BI. The “What’s New in …” topics in the SQL Server 2016 Books Online provides the detailed description of the BI features that made the CTP2 cut. To summarize the major features:

SSAS

  1. Process partitions within a Tabular table in parallel. Previously, partitions within a table were processed sequentially.
  2. New DAX functions. The join-related ones, such as NATURALINNERJOIN, NATURALLEFTOUTERJOIN, UNION, will be useful.

SSRS

  1. Subscription enhancements, such as Enable/disable subscriptions (New user interface options to quickly disable and enable subscriptions), change subscription owner, shared credential for file share subscriptions.
  2. Report Builder for SQL Server 2016 supports High DPI

SSIS

  1. Incremental Package Deployment – ability to deploy individual packages to the SSIS catalog.
  2. AlwaysOn support – ability to host the SSIS catalog on a database configured for AlwaysOn for high-availability

MDS

  1. Improved Manageability – reuse entities across models!
  2. Improved performance – overall performance enhancements for larger models, as well as performance improvement for the Excel MDS add-in.
  3. Improved security
  4. Improved troubleshooting

More exciting features to come later on so stay tuned.


Power BI 2.0 User Provisioning

As a continuation to my “Power BI vNext (let’s now call it Power BI 2.0 to align terminology with Microsoft) SSAS Connector and Security” blog, you might wonder how Power BI provisions users. For example, if a user signs with his business e-mail and a coworker shares BI artifacts with him, what happens when the user leaves the company? Can he still gain access?

As it turns out, when the user signs to Power BI, Microsoft adds the user transparently to the Azure AD (AAD). Syncing AD with AAD is not a requirement. This is why you don’t need to extend your AD to Azure or synchronize it when you want Power BI reports to connect to on-prem Tabular models. If you do not sync your AD with Azure AD and remove user from AD, they continue to exist in Azure AD. If the tenant is a managed tenant (i.e. there is a tenant admin), tenant admin can disable the user in O365 when the user leaves the company. However, if this is an unmanaged tenant (i.e. no admin yet), the company administrator needs to “Take Over” the tenant, as described here. To make this easier, you can do DirSync which will do this automatically or extend your AD to Azure.

What’s New in SQL Server 2016 BI

Lots of announcements and roadmap updates coming from Microsoft Ignite which replaced TechEd and other conferences with one event. My favorites are the What’s New sessions with the BI-specific ones below.

Microsoft SQL Server BI Drill Down

Microsoft BI Overview

What’s New in Master Data Services (MDS) and Integration Services (SSIS) in SQL Server

What’s Next for Business Analytics in Microsoft Excel

Microsoft Azure SQL Data Warehouse Overview

What’s Next for Visualizations in Microsoft Office