Have you looked at your BI spend recently? Sometimes, I’m puzzled by the enormous spending in “this is how we’ve always done it” initiatives that probably could be replaced and done much more efficiently with modern technology and cloud computing. I had a recent conversation with a Chief Analytical Officer of one of the US largest financial organizations. They have outsourced hosting of their 5 TB data warehouse to another company that charge them more than 100K per month. And this is just for hosting on a single SMP SQL Server with no fault tolerance and SLA in place!
Was he surprised to find that this data warehouse could be hosted in SQL Server Data Warehouse on Azure for well under 10K per month? Not to mention that besides x10 cost savings, they’ll get a Massive Parallel Processing (MPP) system on a par with Teradata and Netezza, with the ability to scale up and down with a click of a button? Further, the system will be fully fault tolerant with automatic back-ups. Add the flexibility that comes with moving to the cloud instead of being locked in a vendor that dictates what you should install and run? You’d be surprised how open to the cloud even financial companies might be after realizing these benefits. The same applies to customers who realize what they’re spending in overly expensive BI tools under the pretext that they are still “best in class”. They are not, trust me, and you’re being taking advantage of. It’s time to move on.
https://prologika.com/wp-content/uploads/2016/01/logo.png00Prologika - Teo Lachevhttps://prologika.com/wp-content/uploads/2016/01/logo.pngPrologika - Teo Lachev2016-07-24 19:13:062016-07-24 22:38:33Is Your BI Strategy Cost Effective?
I’m presenting in person “What’s New for BI in SQL Server 2016” for the SQL User Group in Birmingham, AL tomorrow, July 19th starting at 6 PM local time.
Join us Tuesday the 19th in Room 311 of Russell Hall on the Samford University campus for the July meeting of Steel City SQL. This meeting will feature MVP Teo Lachev presenting What’s New for BI in SQL Server 2016.
Food and beverages for this month’s meeting will be provided. If you plan on attending this month’s meeting let us know by registering at steelcitysqljul2016.eventbrite.com so we can plan accordingly. Hope to see you there. When
iCal
UTC : Tue, Jul 19 2016 23:00 – 00:30
Event Time : Tue, Jul 19 2016 18:00 – 19:30 Central Daylight Time
Where
311 Russell Hall – Samford University
Birmingham, Alabama
What’s New for BI in SQL Server 2016
Speaker: Teo Lachev, SQL Server MVP Prologika
Summary: SQL Server 2016 delivers many data analytics and information management new features and enhancements. Join this session to discover what’s new for BI in Database Engine, SSRS, SSIS, SSAS, and MDS. I’ll also explain the SQL Server 2016+ near-future roadmap that will help you implement new solutions and cut cost.
About Teo: Teo Lachev is a consultant, author, and mentor, with a focus on Microsoft Business Intelligence. Through his Atlanta-based company “Prologika”, a Microsoft Gold Partner in Data Analytics, he designs and implements innovative solutions that unlock the power of data and bring tremendous value to his customers, ranging from small companies to Fortune 50 organizations. Teo has authored and co-authored several SQL Server BI books and he has been leading the Atlanta Microsoft Business Intelligence group since he founded it in 2010. Microsoft has recognized Teo’s expertise and contributions to the technical community by awarding him the prestigious Microsoft Most Valuable Professional (MVP) award since 2004.
https://prologika.com/wp-content/uploads/2016/01/logo.png00Prologika - Teo Lachevhttps://prologika.com/wp-content/uploads/2016/01/logo.pngPrologika - Teo Lachev2016-07-18 21:03:512016-07-20 02:17:16Presenting for Steel City SQL User Group, Birmingham
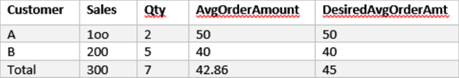
Sometimes, you might run into a scenario that requires an aggregate over an aggregate. Consider the following report:
The AvgOrderAmount has a simple calculation: SUM(Sales)/SUM(Qty). This calculation is applied uniformly. The Total line would divide 300/7 and will return 42.86. However, what is the user wants the result in the DesiredAvgOrderAmt column which produces a simple average over the details (50+40)/2. This could be accomplished by creating a base measure for the detail calculation:
HASONEVALUE would return TRUE when the calculation is performed at the detail level and FALSE in the “grand totals”. In the latter case, it performs a simple average over the detail aggregates. Think of it as performing a second pass over the details to produce an aggregate over aggregates.
https://prologika.com/wp-content/uploads/2016/01/logo.png00Prologika - Teo Lachevhttps://prologika.com/wp-content/uploads/2016/01/logo.pngPrologika - Teo Lachev2016-07-15 20:50:392016-07-15 20:56:02Aggregates over Aggregates in DAX
One great feature of Microsoft BI has been the continuum from personal BI to organizational BI. For example, a business user can start small with an Excel Power Pivot model which IT can restore at some point to a scalable Tabular model. In fact, if you know Microsoft personal BI (Power Pivot or Power BI Desktop), you already know 80% (or even more) of SSAS Tabular.
Unfortunately, currently there isn’t a supported way to restore Power BI Desktop models to Tabular or create a Tabular project from a pbix file. The reason is that because Power BI Desktop is changing on a monthly basis, it’s ahead of Tabular and currently Power BI Desktop doesn’t support backward compatibility. However, the following approach worked for me to upgrade Power BI Desktop to Tabular 2016.
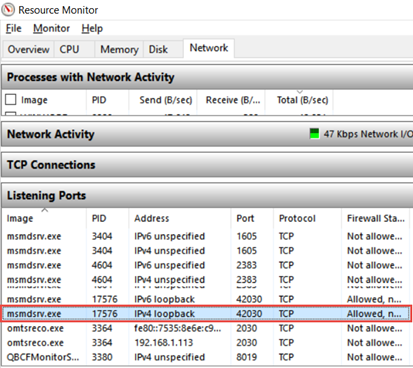
Power BI Desktop has a Tabular child process which is the workhorse for all data crunching you do on the desktop. This process uses a dynamic port. As a first step, you need to find that port. The easiest way to do so is to run Windows Resource Monitor (in the Windows search bar, type resmon). Then, flip to the Network tab, and in the Listing Ports section, find “msmdsrv.exe”, and then note the port number. In my case, I have a few instances of msmdsrv because I run dedicated instances of Multidimensional and Tabular but I found that the PBI Tabular instance ports start above 10000 so it should be easy to identify the instance.
Now that you have the port number, open SSMS 2016 (you can download it from here), and connect to that Tabular instance, using the syntax: localhost:<port number>. For example, to connect to the highlighted instance, in SSMS I’ll Connect ð Analysis Services, and then enter localhost:42030.
TIP: You can also use the SQL Profiler to connect to the PBI Tabular instance and do profiling using SQL Profiler, as Adam Saxton demonstrates here, or using DAX Studio, which by the way automatically enumerates the Power BI Desktop instances.
Right-click the database (the database name is a guid), and click Script ð Script Database As ð CREATE TO ð Clipboard. This will export the database schema in the new JSON format.
Connect to the Tabular instance that will host the database, and create a new Analysis Services XMLA Query, and paste the script. One of the changes you want to make here is to rename the database by change the name element at the beginning of the file so you don’t end up with the same guid for the database name.
Execute the script to create the new database. If you get an error, you should be able to change the script and strip code for features that Tabular doesn’t support. Now that we have JSON-based schema, making such changes should be much easier.
Now you can use SSDT to create a project by importing the Tabular database and continue making changes to the project.
https://prologika.com/wp-content/uploads/2016/01/logo.png00Prologika - Teo Lachevhttps://prologika.com/wp-content/uploads/2016/01/logo.pngPrologika - Teo Lachev2016-07-10 15:29:082016-07-15 20:53:46Upgrading Power BI Desktop Models to Tabular
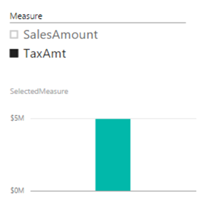
A large publicly-traded organization is currently standardizing on Power BI as a single BI platform as a replacement of Qlik and Tableau. They analysts have prepared a gap analysis of Power BI missing features. On the list was QlikSense variables. The idea is simple. The user is presented with a slicer that shows a list of measures. When the user selects a measure, all visualizations on the report dynamically rebind to that measure. For example, if SalesAmount is selected, all visualizations bound to the variable would show SalesAmount. However, if the user selects TaxAmt than this measure will be used.
As it stands, Power BI doesn’t have this feature but with some DAX knowledge, we can get it done by following these simple steps:
In Power BI Desktop, click Enter Data and create a table called Variable with a single column Measure. Here, I’m hardcoding the selections but they can come from a query of course. Enter the labels of the measures the user will see, such as SalesAmount, TaxAmt, one per row to populate the Measure table.
Create a new measure that has the following formula. Here I use the SWITCH function to avoid many nested IFs in case of many choices.
Add a slicer to you report that shows the Measure column from the Variable table.
Add visualizations to the report that use the SelectedMeasure measure. Now when you change the slicer, reports rebind to the selected measure.
An interesting progression of this scenario would be to allow the user to select multiple measures and adjust the formulas accordingly, such as to sum all selected measures. Another progression would be to change the list depending on who the user is (Power BI now supports data security!)
SQL Saturday Chattanooga will take place on June 25st at UT Chattanooga EMC Building, 784 Vine Street, Chattanooga, Tennessee, 37403, United States. Your humble correspondent will sponsor the event and present “What’s New for BI in SQL Server 2016” scheduled to start at 3:45 PM (the organizers decided to keep the best for last J). Join me for an hour of coverage of my favorite SQL Server 2016 new BI features. Get your questions answered.
SQL Server 2016 delivers many data analytics and information management new features and enhancements. Join this session to discover what’s new for BI in Database Engine, SSRS, SSIS, SSAS, and MDS. I’ll also explain the SQL Server 2016+ near-future roadmap that will help you implement novel solutions and cut cost.
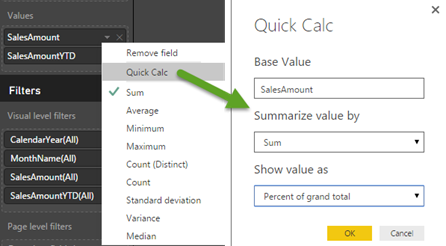
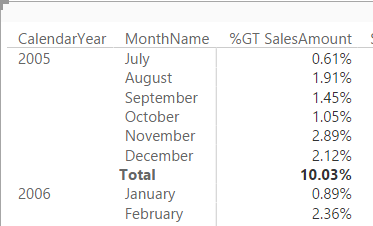
DAX is very powerful but it could entail a steep learning curve for novice users. Power BI Desktop has started on the road of delivering pre-packaged calculations. The first one is Percent of Grand Total. Once you add a measure to the Values zone, you can expand the measure drop-down and click Quick Calc. This is similar to how you would pick one of the default aggregation functions.
Interestingly, Power BI Desktop doesn’t add a new calculation when the Quick Calc feature is used. Instead, it probably creates an implicit DAX measure and you can’t see the formula. The original measure is renamed to %GT <original measure name>.
Prepackaged calculations are a frequently requested Power BI feature. Expect additional quick calculations to light up soon. As a recommendation for improvement, I think that it would be nice to be able to see the DAX formula behind the quick calc.
Are you deciding which BI platform to adopt? With so many vendors and products, you are not alone and the choice is far from easy. For the past few months, I’ve consulted with and mentored several large publicly traded companies to help them understand the benefits of Power BI and teach their staff on how to get the most out of it. Speaking of Power BI and large organizations, Prologika added a new Power BI case study to the Power BI partner showcase that demonstrates why the world’s largest logistic company decided to standardize on a single platform and adopt Power BI. Last but not least, if you are in Atlanta, visit our Atlanta MS BI group which is now the only official local Power BI group. So, if you’re serious about Power BI, check our monthly meetings which now feature plenty of Power BI content.
In this newsletter, I’ll enumerate the most important advantages of Power BI that make it stand out from the rest of the competing platforms. Also, I’ll mention some areas my customers have identified where Power BI has left a room for improvement.
Overall
In this section, I’ll review some general implementation and cost considerations that in my opinion make Power BI a very compelling choice.
Data Platform – No matter how good it is, a self-service visualization tool addresses only a small subset of data analytics needs. By contrast, Power BI is a part of the Microsoft Data Platform that allows you to implement versatile solutions and use Power BI as a presentation layer. Want to implement a real-time dashboard from data streams? Azure Stream Analytics and IoT integrates Power BI. What to show reports on the desktop from natural questions? Cortana lets you do it by typing questions or voice. Want to implement smart reports with predicted results? Power BI can integrate with Azure Machine Learning? Want to publish SSRS and Excel reports? Power BI supports this. Expect this strength to increase as Cortana Analytics Suite and prepackaged solutions evolve.
Cloud First – I know that many of you might disagree here as on-premises data analytics is currently more common, but I see the cloud nature of Power BI as an advantage because allows Microsoft to push out new features much faster than the typical 2-year major release cadence of other vendors. Recall that Power BI Service is updated on a weekly basis while Power BI Desktop is on a monthly release cadence. And because Power BI is a cloud service, it supports the versatile integration scenarios I mentioned before.
Cost – It’s hard to compete with a freemium pricing model. Implementing a BI solution has been traditionally cost prohibitive. However, now Power BI Desktop is free, Power BI Mobile apps are free, Power BI Service is mostly free. If you need the Power BI Pro features, Power BI is packaged with the Office 365 E5 plan, it has an enterprise license, and I’ve heard customers get further discounts from Microsoft.
Next, I’ll review specific Power BI strengths for different user types.
Business Users
By “business users”, I’ll mean information workers that don’t have the necessary skills or desire to create data models.
Content packs and Get Data – Basic data analytics needs can be met in Power BI without modeling. For example, if the user is interested in analyzing data from Salesforce, the user can use the Salesforce content pack and get predefined reports and dashboards. Further, the user can create their own reports from the dataset included in the content pack. What if your cloud data sources have a lot of data and content packs are impractical? Microsoft is rolling out pre-configured scalable solutions (currently, Salesforce and Dynamics CRM).
Productivity features – Power BI has several features that resonate very well with business users. Q&A allows users to ask natural questions, such as “sales last year by country”. Power BI interprets the question and shows the most suitable visualization which the user can change if needed. Within 20 seconds, Quick Insights applies machine learning algorithms that help business users perform root cause analysis and to get insights that aren’t easily discernible by slicing and dicing, such as to find why profit is significantly lower in December. Such productivity features are missing in competing products.
Data Analysts
Data analysts (power users) are the primary audience for self-service BI. Power BI excels in the following areas:
Data shaping and transformations – Source data is rarely clean. Excel Power Query and Power BI Desktop queries allow the data analysts to perform a variety of basic and advanced data transformations. For example, these features could help the data analyst shape the data without staging it first to a relational database.
Sophisticated data models – Power BI offers much more advanced modeling experience where a data analyst can build a self-service model on a par with semantic models implemented by BI pros. For example, the model can have multiple fact tables and conformed dimensions. Power BI supports one-to-many and many-to-many relationships.
Powerful programming language – The Data Analysis Expressions (DAX) excels any other vendor’s programming language.
BI and IT Pros
Besides the ability to integrate Power BI to implement synergistic solutions, pros can build hybrid solutions:
Hybrid solutions – Want to get the best of both worlds: always on the latest visuals while leaving data on premises? Power BI lets you connect to your data on premises.
Semantic layer – Many organizations are considering a semantic layer to achieve a single-version of the truth. If your staff is experienced in Power BI modeling, you’ll find that they already have 80-90% of the knowledge they need to implement a Microsoft-based semantic layer with Analysis Services Tabular. This gives you a nice continuum from self-service to organizational BI. For more information about why a semantic layer is important, read my newsletter “Why Semantic Layer?”.
Developers
Developers has much to gain from the Power BI open extensible architecture.
Custom visuals – Power BI allow developers implement custom visuals which can be optionally shared to Power BI Visuals Gallery.
Extensibility – Power BI has a comprehensive REST API that allow developers to integrate Power BI with custom apps. For example, Power BI let developers push data into datasets for real-time dashboards and manipulate deployed objects programatically. Power BI Embedded, currently in preview, allows developers to embed interactive reports without requiring installation of tools and with very attractive licensing model.
Improvement Areas
Here are some areas that customers have identified where Power BI needs improvement:
Direct Query – Currently, Direct Query is limited to a single data source. Microsoft should extend Direct Query to support multiple data sources within a single model.
File size limits – Power BI Service (powerbi.com) is currently limited to 1 GB maximum file size. Some customers have indicated that their data analysts require larger file extracts. My personal advise has been that such large extracts should be avoided in favor of a centralized semantic layer.
DAX complexity – Customers have expressed concerns about the DAX complexity that the lack of quick calculations. Microsoft has already started addressing this by adding the Percent of Total quick calculations. Expect other calculations to light up shortly.
Variables – One large organization transitioning from Qlik/Tableau has pointed out that Power BI lacks variables and parameters, such as to dynamically bind several visualizations to a measure that is chosen as a parameter.
Exporting reports and datasets from Power BI Service to Power BI Desktop – This is currently not supported but high on the Power BI roadmap.
Predictive capabilities – Currently, besides using R or integrating with Azure Machine Learning, Power BI doesn’t have native forecasting capabilities, such as to forecast future months. This is a frequently requested feature and very high on the roadmap.
Drillthrough limitations – Different drillthrough options in Power BI has different limitations. For example, exporting to CSV is limited to 10,000 rows, while drilling through a chart data point is limited to 1,000 rows. This limits will probably lifted in Power BI Pro. Meanwhile, you can use the Analyze in Excel feature and drillthrough in Excel pivot reports which gives you an option to drill through 1,048,576 rows.
Data reduction algorithms – Currently, Power BI visualizations employ data reduction algorithms to limit the number of data points to plot. This is high on the roadmap and there is a work underway to address this limitation.
Replacement for paginated reports – Some organizations have hoped that Power BI can be a replacement of other vendors’ products for paginated (pixel-perfect) reports. Power BI reports are designed for quick data exploration and not as paginated reports. However, SSRS is the Microsoft product for paginated reports. Moreover, SSRS 2016 has been extended significantly to fulfill a very important role in the Microsoft on-premises reporting roadmap.
Maturity – I often hear that Power BI is great but it’s not mature. In my opinion, you should view Power BI to be as mature (or even more mature) as other tools. That’s because the Power BI building blocks have been around for many years, including xVelocity (the in-memory data engine where imported data is stored), Power Query, Power Pivot, Power View, Tabular, and Azure cloud infrastructure.
As you’d probably agree, the BI landscape is fast-moving and it might be overwhelming. If you need any help with planning and implementing your next-generation BI solution, don’t hesitate to contact me. As a Microsoft Gold Partner and premier BI firm, you can trust us to help you plan and implement your data analytics projects, and rest assured that you’ll get the best service.
Regards,
Teo Lachev Prologika, LLC | Making Sense of Data Microsoft Partner | Gold Data Analytics
I helped a customer to implement ADOMD.NET connection pooling with the goal to increase significantly the query throughput. Their predictive service platform had to scale to thousands of queries per minute. However, as it stands, ADOMD.NET doesn’t have connection pooling. Normally, this is not an issue (see the implementation details of how SSAS handles connections here), but in this case the application was constantly opening and closing connections under a dedicated (trusted) account to send singleton DMX queries. Interestingly, performance counters wouldn’t show pressure on the SSAS server but for some reason the client has blocking for long periods after a certain number of open connections (could be related to TCP/IP port exhaustion).
The solution was to implement custom ADOMD.NET connection pooling. You can find the .NET source here. The code should be easy to follow. It uses a Queue class to cache up to 50 connections. When the client needs a connection, the pool manager dequeues the connection from the pool. When the client is done with the connection, it returns the connection to the pool (there is some sample code at the end that shows this). The connection manager had to be thread-safe as multiple threads could use the connection manager at the same time.
This code went to production and the customer reported remarkable results. “The first of the month is by far our biggest day: we are calling this service at rates approaching 1500 calls/min!”
In my opinion, every mid-size to large organization should have a solution for master data management. Based on my observations, data quality issues have reached a pandemic level. Ironically, putting a “lipstick on the pig” with some cool visualizations appears to have a higher priority on the BI roadmap but it’s just masking the underlying issues. The focus should be on centralizing data management and improving data quality. I know this is easier said than done and the problem is further complicated by the proliferation of systems and corporate acquisitions. I know an organization which spent $8M (kid you not) on a MDM project with one of the most prominent management consulting companies and all they got back after two years was slides and documentation. It shouldn’t be this way of course. But start somewhere…. Start small, perhaps with putting under control all of these Excel spreadsheets that are floating around in your company (aka referenced data).
And you don’t have to break the bank for software. Luckily, SQL Server has a great toolset for master data management and data quality. Speaking of which, I’m happy to announce my latest training class: Applied Master Data Services and Data Quality. This two-day class is designed to help you become proficient with SQL Server 2016 Master Data Services (MDS) and Data Quality Services (DQS). IT and business users will learn how to design MDS models and extend them with business rules, attribute groups, and hierarchies. IT will learn how to integrate MDS with upstream and downstream systems and how to enforce secured access. Business users will learn how to use Excel to manage data with the tool they love most – Excel! Then, the class teaches how to create DQS knowledge bases, perform matching and cleansing tasks, and integrate DQS with MDS and SSIS. The class can be customized to target separately pro and business user audiences.
https://prologika.com/wp-content/uploads/2016/01/logo.png00Prologika - Teo Lachevhttps://prologika.com/wp-content/uploads/2016/01/logo.pngPrologika - Teo Lachev2016-05-31 15:54:572016-06-03 05:45:40Applied MDS and DQS Training Class Available