Auditing Row Counts in SSIS

It’s a good practice to have a custom ETL framework that augment the SSIS capabilities. ETL frameworks come in different shapes and sizes but what I’d like to see in a framework is:

  1. Configurable parallelism – Does your ETL take hours? The chances are that your packages run sequentially. Or, disconnected flows in the master package’s control flow support limited parallelism, while your server probably has much bigger pipeline. By contrast, the framework we use support configuring the degree of parallelism and automatically distributes packages to be executed on different threads.
  2. Target and actual package execution duration – You must proactively monitor when the actual package execution exceeds its target duration. See my newsletter “Is ETL (E)ating (T)hou (L)ive?” of a real-life example of what could happen if you don’t do this. Plan to implement an ETL dashboard for monitoring the package execution against its target and to let the users know what date the data is current as by every source system.
  3. Restartability – Resume package execution from the point of failure.
  4. Sufficient auditing checks to ensure data quality – This is usually done by recording row counts of extracted, inserted, updated, and deleted rows. I’d also like to see ETL packages doing some quality checks to ensure the data is consistent as it moves through the pipeline (source, staging, DW, cubes).

I’m currently auditing an ETL implementation where the original developers didn’t record row counts. Citing regulatory requirements, such as The Sarbanes-Oxley Act, the ETL was later”enriched” to record before and after row counts of every possible DML operation. If this is the stated business requirement, then that’s fine but before you start on this this path, consider that the SSIS catalog provides counts for data flow tasks. Before SQL Server 2016, collecting these counts would require enabling Verbose logging. This wasn’t a recommended practice because of the additional overhead. However, in SQL Server 2016 you can create a custom logging level to record only the things you need. Follow these steps to create  custom logging level in order to capture row counts:

  1. Right-click the SSIS catalog and then click Customized Logging Level. Click the Create button and choose which of the system-defined logging levels you want to use as a base, e.g. Basic.
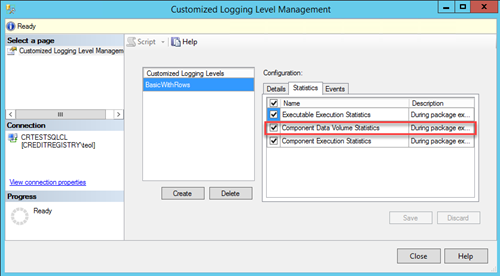
  2. To record the row counts, make sure to select Component Data Volume Statistics in the Statistics tab.
  3. When configure your job with SQL Server Agent, go to the Configuration tab, click the Advanced Tab, and then select the custom logging level you created in the “Logging level” drop-down.

Because the row counts are recorded for each buffer in the data flow task, in SSMS connect to the SSISDB database and execute this query to group by package, task, and component to see how many rows has gone through each component over time:

SELECT package_name, task_name, [source_component_name] , max(created_time) as created_time, SUM([rows_sent])  AS rows_sent
FROM [catalog].[execution_data_statistics]
GROUP BY package_name, task_name, [source_component_name]
order by 4

As useful as this is, it captures only the row counts in data flow tasks. It won’t record DML operations that are taking place in the Control Flow, such as in Execute SQL Tasks that are calling stored procedures. If capturing row counts in Control Flow is required, you have to do so on your own.

It’s unlikely that capturing row counts alone would satisfy stringent auditing requirements, such as when was the row changed, what change was made and what was the old values. Instead, consider using another feature introduced in SQL Server 2016 Database Engine: temporal tables. By configuring your destination tables as temporal, you let SQL Server to capture data changes in a history table. Now you have a rich audit trail.

Atlanta MS BI Group Meeting on February 27th

MS BI fans, join me for the next Atlanta MS BI and Power BI Group meeting on Monday, February 27th at 6:30 PM. Paco Gonzales from SolidQ will introduce to Azure Cognitive Services and walk us through the process to build a bot. SolidQ will sponsor the event. I’ll show two existing new Power BI features: clustering and binning.

Rate this meetinghttp://aka.ms/PUGSurvey, PUG ID: 104
Presentation:Bot Framework and Cognitive Services
Level: Intermediate
Date:February 27, 2017
Time6:30 – 8:30 PM ET
Place:South Terraces Building (Auditorium Room)

115 Perimeter Center Place

Atlanta, GA 30346

Overview:Cognitive computing (CC) describes technology platforms that are based on the scientific disciplines of Artificial Intelligence and Signal Processing. These platforms encompass machine learning, reasoning, natural language processing, speech and vision, human-computer interaction, dialog and narrative generation and more. Join this session for an overview of the Microsoft Bot Framework and Cognitive Services. During this session we will build and deploy a bot. We will also browse the different Cognitive Services APIs: Face, Vision, Speech, Text.
Speaker:Paco Gonzalez is the Director of the Center of Excellence at SolidQ. As a MCSE – Data Management and Analytics, a MCT (Microsoft Certified Trainer) and MVP (Microsoft Most Valuable Professional) – Data Platform. Paco excels at leveraging advanced analytic technology to bring the highest value to client businesses.
Sponsor:SolidQ delivers services for Microsoft platforms that help you architect, integrate and optimize your use of data. The result? Our clients think bigger and move faster because we help them build the capacity and skills to interact with data in creative, collaborative ways that deliver new insights to the business. At SolidQ we measure our success by your satisfaction – and we guarantee it.
Prototypes with Pizza“Power BI clustering and binning” with Teo Lachev


Vote to Give Tabular SE More Memory

I’m a big fan of Analysis Services and I’m doing a lot of work lately with Tabular. I rejoiced a lot after Microsoft included Tabular in SQL Server 2016 Standard Edition to increase its adoption but my enthusiasm was dampened by its maximum memory size of 16 GB. Interestingly, Multidimensional enjoys 64 GB of RAM in Standard Edition although you probably never need that much memory for OLAP cubes. As a memory-resident technology, Tabular is memory hungry. The current limitation of 16 GB is impractical. Twice the memory is required to process the database, leaving us with a database size of no more than 5 GB to be on the safe side. So, I started a quest to convince Microsoft to bring Tabular on a par with Multidimensional and increase its memory limit in Standard Edition to 64 GB. If you agree, please vote for my feedback on Connect.

Gartner’s 2017 BI and Data Analytics Magic Quadrant Shows Microsoft Leading

Power BI is enjoying a tremendous momentum and unprecedented popularity. Just within this month, your humble correspondent has been teaching Power BI four times in a row. It looks like industry observers are taking notice of this momentum. As Kamal Hathi (General Manager, Microsoft BI) announced, the newly released Garner Magic Quadrant for Business Intelligence and Data Analytics gave Microsoft a very high score. The image below shows the Microsoft’s lift between last year and this year in the Gartner magic quadrant.

I’m not surprised about the Qlik drop given they sold out the company. What’s still surprising to me is that Gartner ranked Tableau and Microsoft almost the same on the ability to execute. Although the report is not out yet, judging by the stub, Gartner used the same 14 criteria as last year, but added one more which is unknown at this point (probably real-time where Microsoft can score very high as well). Here are my comments on where Microsoft stands on these 14 criteria. You might also find my two-part blog about Tableau vs. Microsoft useful if you are tasked to compare vendors.

Capability

Teo’s Rank for MS BI

Comments
InfrastructureBI Platform Administration
Capabilities that enable scaling the platform, optimizing performance and ensuring high availability and disaster recovery

High

On premises or cloud, I think the MS BI Platform is second to none
Cloud BI
Platform-as-a-service and analytic-application-as-a-service capabilities for building, deploying and managing analytics and analytic applications in the cloud, based on data both in the cloud and on-premises

High

Power BI supports both pure cloud and hybrid architectures
Security and User Administration
Capabilities that enable platform security, administering users, and auditing platform access and utilization

Medium

More work is required to support external users in Power BI, Power BI Embedded, and SSRS
Data Source Connectivity
Capabilities that allow users to connect to the structured and unstructured data contained within various types of storage platforms, both on-premises and in the cloud.

High

As of this time, Power BI supports close to 70 connectors to let you connect to cloud and on-premises data sources. No scripting required.
Data ManagementGovernance and Metadata Management
Tools for enabling users to share the same systems-of-record semantic model and metadata. These should provide a robust and centralized way for administrators to search, capture, store, reuse and publish metadata objects, such as dimensions, hierarchies, measures, performance metrics/key performance indicators (KPIs) and report layout objects, parameters and so on. Administrators should have the ability to promote a business-user-defined data model to a system-of-record metadata object.

Medium

Power BI has done a good job to provide auditing and admin oversight but more work is required for proactive monitoring and improving its data governance capabilities
Self-Contained Extraction, Transformation and Loading (ETL) and Data Storage
Platform capabilities for accessing, integrating, transforming and loading data into a self-contained storage layer, with the ability to index data and manage data loads and refresh scheduling.

Medium

SSIS is the most popular on-premises ETL tool. More work is required to bring similar capabilities in the cloud (I think Azure Data Factory is a step backwards)
Self-Service Data Preparation
The drag-and-drop, user-driven data combination of different sources, and the creation of analytic models such as user-defined measures, sets, groups and hierarchies. Advanced capabilities include semantic autodiscovery, intelligent joins, intelligent profiling, hierarchy generation, data lineage and data blending on varied data sources, including multistructured data

High

Power BI Desktop and Excel has a fantastic query editor (originated from Power Query) that scores big with business users. Tableau doesn’t have such native capabilities. Power BI and Excel have best of class self-modeling capabilities (much better than Tableau). Azure Query Catalog can be used for dataset autodiscovery.
Analysis and Content CreationEmbedded Advanced Analytics
Enables users to easily access advanced analytics capabilities that are self-contained within the platform itself or available through the import and integration of externally developed models.

High

Not sure what is meant here by “advanced analytics capabilities”. Power BI supports integration with R, Azure Machine Learning, clustering, forecasting, binning, but I might be missing something.
Analytic Dashboards
The ability to create highly interactive dashboards and content, with visual exploration and embedded advanced and geospatial analytics, to be consumed by others

High

“Highly interactive dashboards and content” is what Power BI is all about.
Interactive Visual Exploration
Enables the exploration of data via the manipulation of chart images, with the color, brightness, size, shape and motion of visual objects representing aspects of the dataset being analyzed. This includes an array of visualization options that go beyond those of pie, bar and line charts, to include heat and tree maps, geographic maps, scatter plots and other special-purpose visuals. These tools enable users to analyze the data by interacting directly with a visual representation of it

High

According to Gartner’s definition, Power BI should score high but more work is required on the visualization side of things, such as ability to drill through a chart point as we can do in SSRS.
Mobile Exploration and Authoring
Enables organizations to develop and deliver content to mobile devices in a publishing and/or interactive mode, and takes advantage of mobile devices’ native capabilities, such as touchscreen, camera, location awareness and natural-language query

High

Native apps for iOS, Android and Windows to surface both Power BI and SSRS reports.
Sharing of FindingsEmbedding Analytic Content
Capabilities including a software developer’s kit with APIs and support for open standards for creating and modifying analytic content, visualizations and applications, embedding them into a business process, and/or an application or portal. These capabilities can reside outside the application (reusing the analytic infrastructure), but must be easily and seamlessly accessible from inside the application without forcing users to switch between systems. The capabilities for integrating BI and analytics with the application architecture will enable users to choose where in the business process the analytics should be embedded.

High

An Azure cloud service, Power BI Embedded allows you to do this with an appealing cost-effective licensing model.
Publishing Analytic Content
Capabilities that allow users to publish, deploy and operationalize analytic content through various output types and distribution methods, with support for content search, storytelling, scheduling and alerts.

Medium

Power BI supports subscriptions and data alerts but we can do better, such as to allow an admin to subscribe other users. “Storytelling” can mean different things but I thought the integration with Narrative Science can fall into this category.
Collaboration and Social BI
Enables users to share and discuss information, analysis, analytic content and decisions via discussion threads, chat and annotations

High

Power BI supports this with workspaces and Office 365 unified groups.

Of course, there are many competing definitions of what constitutes a BI and Analytics platform. Again, it looks to me that Gartner has predominantly focused on the self-service BI aspect of it (even there Microsoft should have scored higher) and ignored the SQL Server BI features and all the cloud BI-related products (Azure SQL Database, SQL Data Warehouse, Azure ML, Query Catalog, HDInsight, StreamInsight). If we take them in consideration, where will that dot be?

Types of Power BI Real-time Datasets

Everyone wants real-time BI, even when it doesn’t have to be really “real time”. Today Microsoft announced General Availability of Power BI Real-Time Streaming Datasets. There are actually three types of Power BI real-time datasets, as mentioned in the documentation.

  • Push – Power BI permanently stores the data, enabling historic analysis, and reports creation atop the dataset. Behind the scenes, Power BI provisions an Azure SQL instance when the dataset is created. New data is pushed into SQL. Power BI then connects to that dataset via DirectQuery. Query Refresh (sending new queries to Azure SQL to update dashboard visuals) occurs whenever data is pushed in. When you create the dataset programmatically, you can specify a retention policy (defaultRetentionPolicy setting). When defaultRetentionPolicy is set to None, the dataset accumulates data to the maximum allowed Power BI limit (currently 1 GB). When set to basicFIFO, the dataset holds up to 200,000 rows and after that older rows are pushed out when the new ones come in.
  • Streaming — Power BI stores the data only in a transient cache – this means report creation, historic analysis is disabled, but in return there is consistently lower latency between when the data is pushed in and when the visuals update. The data flows into a Redis cache, and the dashboard visuals directly pull data from that Redis cache. Therefore, consider streaming datasets when you want the lowest latency (we are talking about milliseconds here) but you are limited to a few pre-defined visualizations supported by the Power BI dashboard real-time tiles. You can’t create custom reports.
  • Hybrid — Hybrid datasets send data to both the “push” and “streaming” endpoints, thereby getting the benefits of both at the expense of duplicate storage.

Unless you use StreamInsight (currently, it supports only push datasets) or PubNub (supports streaming datasets), you must create the dataset programmatically using the Power BI REST APIs. Currently, you can’t use Power BI Desktop to create real-time datasets.

Atlanta MS BI Group Meeting on January 30th

MS BI fans, join me for the next Atlanta MS BI and Power BI Group meeting on Monday, January 30th at 6:30 PM. One of our most experienced consultants, Neal Waterstreet, will share his real-life experience in master data management with SQL Server MDS. I’ll update you on the latest with Power BI and SQL Server 2017. Prologika will sponsor the meeting.

Rate this meetinghttp://aka.ms/PUGSurvey, PUG ID: 104
Presentation:Master Data Management with SQL Server 2016 MDS
Level: Intermediate
Date:January 30th, 2017
Time6:30 – 8:30 PM ET
Place:South Terraces Building (Auditorium Room)

115 Perimeter Center Place

Atlanta, GA 30346

Overview:In this presentation we’ll first discuss the position Master Data Management plays in an organization’s overall data strategy. We’ll review the key concepts, different roles and responsibilities that members of the team typically play, potential risks, and best practices to help you get your organization moving forward with MDM. We’ll then take a look at some of the features of MDS 2016 such as the different ways of processing data, security improvements, Changesets and Entity Sync that make it an excellent tool for MDM.
Speaker:Neal Waterstreet is a BI Architect/Consultant with Prologika. He has more than 20 years of industry experience. Neal is skilled in the entire BI spectrum, including dimensional modeling, ETL design and development using Integration Services (SSIS), designing and developing multidimensional cubes and Tabular models using Analysis Services (SSAS) and Master Data Management using Microsoft Data Services (MDS). He’s also involved with the database community and is the co-founder and co-leader of the PASS Healthcare Virtual Chapter and the Atlanta Modern Excel User Group.
Sponsor:Prologika is one of the most trusted names in Data Analytics. Our clients, from small businesses to Fortune 100 enterprises, derive tremendous value from our services. Our mission is to help organizations make sense of data by applying the latest technologies for descriptive and predictive analytics and get actionable insights. Your organization will spend less time mining for information and be better equipped to make sound business decisions.
Prototypes with Pizza“Power BI subscriptions” and “Update on deploying Power BI reports to SSRS” by Teo Lachev

Unblocking the On-premises Data Gateway

Scenario: You have configured the Power BI on-premises data gateway for centralized data access and verified that its data sources test just fine. Direct query connections work. However, when you go to Power BI Service and attempt to schedule a data refresh for a dataset, you might find that the data gateway is disabled.

Solution: The most common reasons for Power BI to disable the on-premises data gateway for refresh are:

  1. Unlike the personal gateway, the on-premises data gateway requires you to register data sources. You must go to the gateway properties and create data sources for all data sources used in your Power BI Desktop file. Unfortunately, as it stands Power BI doesn’t allow you to select which data sources in the Power BI Desktop file will be refreshed and which ones don’t require a refresh. It’s all or nothing proposition. So, if one data source is not compatible or can’t be refreshed, the gateway will be disabled.
  2. The connection strings in data sources in the Power BI Desktop file might differ from the settings of the data sources you registered in the on-premises gateway. For example, in Power BI Desktop you might have imported data from a local Excel file. Then, you might have moved the file to a network share and established a gateway data source to point to the network share. Because the connection strings differ, Power BI Service won’t find an on-premises gateway to serve the Excel file and it will disable the gateway for refresh. So, triple-verify the that data sources match.
  3. You might have manually added a table to your model and entered some data using the Power BI Desktop “Enter Data” feature. Because custom tables can’t refresh, Power BI disables the gateway.

012817_0130_Unblockingt1.png

Customer Success Case – ZynBit

One of our customers, ZynBit, made the Power BI blog today! Initially, ZynBit was considering Tableau but abandoned it in favor of Power BI because of the Power BI superior data modeling capabilities and the cost effective licensing model of Power BI Embedded. Prologika helped ZynBit to transition their solution to Power BI, including designing the data model and integrating reports with Power BI Embedded. Read our case study here.

Monitoring Progress of UPDATE

How to monitor the progress of an UPDATE statement sent to SQL Server? Unfortunately, SQL Server currently doesn’t support an option to monitor the progress of DML operations. In the case of UPDATE against large tables, it might be much faster to recreate the table, e.g. with SELECT … INTO. But suppose that INSERT could take a very long time too and you prefer to update the data instead. Here is how to “monitor” the progress while the UPDATE statement is doing its job.

Suppose you are updating the entire table and it has 138,145,625 rows (consider doing the update in batches to avoid running out of log space). Let’s say the UPDATE statement changes the RowStartColumn column to the first day of the month:

UPDATE bi.FactAccountSnapshot

SET RowStartDate DATEADD(MONTHDATEDIFF(MONTH, 0, RowStartDate), 0);

Use these statements to monitor the remaining work by using a reverse WHERE clause. Make sure to execute both statements (SET TRAN and SELECT together) so that the SELECT statement can read the uncommitted changes.

SET TRAN ISOLATION LEVEL READ UNCOMMITTED;

SELECT CAST(1 – CAST(COUNT(*) AS DECIMAL/ 138145625 AS DECIMAL(5, 2)) AS PercentComplete ,COUNT(*) AS RowsRemaining

FROM bi.FactAccountSnapshot

WHERE RowStartDate <> DATEADD(MONTHDATEDIFF(MONTH, 0, RowStartDate), 0);

What about INSERT? If you know how many rows you are inserting, you can simply check the current count of the inserted rows by using the sp_spaceused stored procedure:
sp_spaceused ‘tableName’.

Make BI Great Again!

…with the second edition of my “Applied Microsoft Power BI” book. After seven books and starting from scratch every time, I finally got to write a revision! Thoroughly revised to reflect the current state of Power BI, it added more than 20% new content and probably that much content was rewritten to keep up with the ever changing world of Power BI. Because I had to draw a line somewhere, Applied Microsoft Power BI (2nd Edition) covers all features that were that were released by early January 2017 (including subscriptions). As with my previous books, I’m committed to help my readers with book-related questions and welcome all feedback on the book discussion forum on the book page. While you are there, feel free to check out the book resources (sample chapter, front matter, and more). Consider also following my blog at https://prologika.com/blog and subscribing to my newsletter at https://prologika.com to stay on the Power BI latest.

  • Buy the paper copy from Amazon
  • Buy the Kindle ebook from Amazon
  • Other popular channels in 2-3 weeks