APPLIED MICROSOFT POWER BI (6th Edition)
 (BRING YOUR DATA TO LIFE!)
Applied Power BI (6th Edition)Bring your data to life today and learn how Power BI changes the way everyone gains insights from data.

    • Publication date: 1/1/2021
    • Size: 556 pages, 7.5″ x 9.25″
    • Price: $49.99
    • ISBN 10: 1-7330461-2-7
    • ISBN 13: 978-1-7330461-2-1

Introduces information workers, data analysts, IT pros, and developers to Microsoft Power BI — a cloud-hosted, business intelligence and analytics platform that democratizes and opens BI to everyone, making it free to get started!

Power BI changes the way you gain insights from data; it brings you a cloud-hosted, business intelligence and analytics platform that democratizes and opens BI to everyone. It does so under a simple promise: “five seconds to sign up, five minutes to wow!”

Synopsis

An insightful tour that provides an authoritative yet independent view of this exciting technology, this guide introduces Microsoft Power BI—a cloud-hosted, business intelligence and analytics platform that democratizes and opens BI to everyone, making it free to get started!

Information Workers will learn how to connect to popular cloud services to derive instant insights, create interactive reports and dashboards, and view them in the browser and on the go! Data Analysts will discover how to integrate and transform data from virtually everywhere and then implement sophisticated self-service models for descriptive and predictive analytics. The book also teaches BI and IT Pros how to establish a trustworthy environment that promotes collaboration, and they’ll implement Power BI-centric solutions for organizational BI. Developers will find out how to integrate custom applications with Power BI, to embed reports, and to implement custom visuals to effectively present any data.

Ideal for both experienced BI practitioners and beginners, this book doesn’t assume you have any prior data analytics experience. It’s designed as an easy-to-follow guide that introduces new concepts with step-by-step instructions and hands-on exercises.


What’s inside

  • Get insights from popular cloud services on any device!
  • Implement sophisticated personal BI models!
  • Enable team BI and implement descriptive, predictive, and real-time BI solutions!
  • Extend Power BI with custom visuals and report-enable custom apps!
    … and much more!

Resources

Front matterSample chapter (Chapter 1)Errata
IndexSource codeForum
Back coverFirst edition page
Second edition page
Third edition page
Fourth edition page
Fifth edition page

Reviews

“The true power in Power BI cannot be appreciated without understanding what the offering can do and how to best use it. That is why resources like this fantastic book will become instrumental for you. This book starts by providing an overview of the main components of Power BI. It introduces Power BI Desktop, data modeling concepts, building reports, publishing and designing dashboards. Readers will be up and running in no time. It then moves on to bring you up to speed on deeper dive topics such as data gateways, data re-fresh, streaming analytics, embedding and the Power BI data visualization API. Not only is Teo one of the first people in the world to learn and write about Power BI 2.0, he also brings a wealth of knowledge from deploying the first real-world implementations. Much like Teo’s previous books on Analysis Services and Reporting Services, this Power BI book will be a must read for serious Microsoft professionals. It will also empower data analysts and enthusiasts everywhere.”

Jen Underwood
Principal Program Manager, Microsoft Business Intelligence

“I’m impressed about the breadth of the topics covered by Teo Lachev in this book, I’ve just took a quick look at every chapter, and Teo covered all the topics at least at the point where you can start doing something (and in some chapter also more than just an intro). Considering the speed of Power BI releases and the effort required in writing a book, I know the huge effort behind this. My kudos to this book!”

Macro Russo
Consultant, SQLBI


How to purchase

Buy the paper copy from Amazon
Buy the Kindle ebook from Amazon

Atlanta MS BI and Power BI Group Meeting on January 4th

Please join us online for the next Atlanta MS BI and Power BI Group meeting on Monday, January 4th, at 6:30 PM.  James Serra (Big Data/Data Warehouse Evangelist at Microsoft) will share best practices around staging data in an organizational data lake. For more details, visit our group page and don’t forget to RSVP (fill in the RSVP survey if you’re planning to attend).

Presentation:Data Lake Overview
Date:January 4th, 2020
Time6:30 – 8:30 PM ET
Place:Click here to join the meeting

Learn More | Meeting options

Overview:The data lake has become extremely popular, but there is still confusion on how it should be used. In this presentation I will cover common big data architectures that use the data lake, the characteristics and benefits of a data lake, and how it works in conjunction with a relational data warehouse. Then I’ll go into details on using Azure Data Lake Store Gen2 as your data lake, and various typical use cases of the data lake. As a bonus I’ll talk about how to organize a data lake and discuss the various products that can be used in a modern data warehouse.
Speaker:James Serra is a big data and data warehousing solution architect at Microsoft.  He is a thought leader in the use and application of Big Data and advanced analytics. Previously, James was an independent consultant working as a Data Warehouse/Business Intelligence architect and developer. He is a prior SQL Server MVP with over 35 years of IT experience. James is a popular blogger (JamesSerra.com) and speaker. He is the author of the book “Reporting with Microsoft SQL Server 2012”.
Prototypes without pizza:Power BI Latest

PowerBILogo

Microsoft Dataverse: A Verse Without Rhymes

The cloud is supposed to make things easier, right? Well, not necessarily, as a client and I have recently discovered. They use Dynamics Online 365 and they are facing long refresh times for Power BI datasets that import data from Dynamics. Dynamics saves its data in an Azure SQL Database, which now goes by the name Dataverse (previously known as Common Data Service for Apps or CDS-A). I wrote two years ago about the pros and cons of CDS-A. The ugly award back then went to getting the data out of Dynamics. I wrote “For years people were complaining that after migrating from the on-premises Dynamics to the cloud, they lost the ability to connect to its database directly and they had to rely on the REST APIs (slow) or Data Export Service to export the data to an SQL Server Database (fast but requires additional effort and budget).”

Have things changed in the past two years? Yes, but not necessarily for better. Microsoft now has three ways of getting the data out of Dynamics (staging to Azure SQL Database has been deprecated).

OptionProsCons
Connect to Dynamics REST APIsAbility to pass predicates on the REST API call, such as column lists, joins, and filtersSlow, no query folding
Staging to ADLSMicrosoft preferred approach, automatic data synchronizationNo query folding, no DirectQuery, not enough compute resources
DTS endpointImport and DirectQuery modes, query folding worksNot enough compute resources, not a strategic option

Let’s take a more in-depth look at the new options: staging to ADLS and the DTS endpoint.

Staging to ADLS

Microsoft invests heavily and recommends staging the Dynamics data out to Azure Data Lake Storage Gen 2 (ADLS). Once you set up your data lake, you go to the Power Platform Admin Center and specify which entities you want to stage out. Once the initial snapshot completes, changes to Dynamics entities are automatically propagated in almost real time. From there, you can use the Power BI “Azure Data Lake Storage Gen 2” connector (make sure to expand the “cdm” folder) to import the data. Microsoft explains the process in more detail in this video. What a clumsy solution though! From a perfect store (SQL Server) that supports querying, joining, query folding, etc, we stage the data out and save it as flat files and lose all of these. You would think that the Power BI refreshes will be blazingly fast. After all, we read from a bunch of CSV files. Unfortunately, I ran some tests to import an entity that had around 1 million rows and I had to cancel it after one hour. By comparison, the original query that used the REST API clocked at 30 minutes. How come?

The moment you stage data to flat files you embrace a very inefficient way of consuming that data. Since there is no “server”, Power Query can’t pass predicates to the data source. So, if you have an entity with a million rows and you need only a few columns and a subset of rows, Power Query would load all the data from the data lake before it applies the predicates.

As we’ve found, ADLS will not cut through this much data as it does not have the compute and Power Query itself does not bring enough compute for large datasets and joins, etc. Microsoft’s solution? Throw in more compute by using the Synapse SQL on-demand connector so the architecture now becomes Dynamics -> ADLS -> Synapse (OD) -> Power BI! Of course, this will entail an additional investment on your part in the “compute” layer, but this is the price to pay when you want your data fast, right?

Consider the ADLS staging only for small entities unless you want to invest in Synapse. I personally decided against pursuing this path as it’s an overkill for the simple request to get access to the data.

TDS Endpoint

I rejoiced when I recently learned that we know have a TDS endpoint to Dataverse. TDS is the native protocol that SQL Server uses to communicate with the client app. The TDS endpoint is essentially a wrapper on top of the Dataverse Azure SQL Database. And Power BI has a Dataverse connector that supports import and DirectQuery modes. Time to celebrate, right? This is exactly what we wanted since now we don’t have to worry about staging the data out and running out of compute thanks to the horribly inefficient way of loading data from ADLS. We now have real-time access to data and Power Query can pass predicates to SQL Server.

Unfortunately, no luck importing that entity as the refresh timed out. As it turned out, TDS endpoint is meant for real-time reporting over relatively smaller (no definition from Microsoft about “smaller”) datasets. With large datasets and joins involved queries would require even more compute and processing time. So, back to square one. We don’t have enough compute there too and there is no workaround. And Microsoft doesn’t plan to invest in the TDS endpoint since staging to ADLS is their preferred solution.

I failed to understand what prevents Microsoft from assigning more “compute” to the TDS endpoint. Surely, customers spending millions in licensing fees deserve an option for a dedicated environment with enough compute like Power BI offers with premium capacities. If the concern is that direct access can impact production loads, this is something the client should worry about and address, such by connecting to the read-only replica of the Azure SQL Database, which I’m sure it’s privately available.

I always consider it a travesty when SaaS apps don’t give you access to the data in its native storage, which usually is a relational database, and therefore a perfect store.  Join my quest to persuade Microsoft in providing direct access with enough compute to your data in the cloud as you have with their on-prem offerings.


Prologika Newsletter Winter 2020

I hope you’re enjoying the holidays. In this newsletter, I’ll discuss a very important enhancement to Power BI that lets business users extend semantic models. But before I get to it, a quick announcement. I’m putting the finishing touches of the sixth edition of my “Applied Microsoft Power BI”! It should be available on Amazon in the first days of 2021. I’ve been updating this book thoroughly every year since 2015 to keep it up to the date with this fast-changing technology.

I’ve written extensively on the important role that EDW and organizational semantic models have for delivering the “Discipline at the core and flexibility at the edge” tenant for effective data analytics. Analysis Services Tabular is available in three SKUs: Power BI, Azure Analysis Services, and SSAS, and it’s the workhorse of Power BI Service. When you publish a Power BI desktop file, it becomes a database hosted in some Analysis Services Tabular server managed by Microsoft.

How live connections work

As the diagram below shows, Power BI uses a special live connectivity option when you connect live to Analysis Services in all its flavors (Multidimensional, Tabular, and Power BI published datasets) and SAP (SAP Hana and SAP Data Warehouse). In this case, the xVelocity engine isn’t used at all and the model is absent. Instead, Power BI connects directly to the data source and sends native queries. For example, Power BI generates DAX queries when connected to Analysis Services .

There is no Power Query in between Power BI Desktop and the data source, and data transformations and relationships are not available. In other words, Power BI becomes a presentation layer that is connected directly to the source, and the Fields pane shows the metadata from the model. This is conceptually very similar to connecting Excel to Analysis Services.

Unfortunately, once you connected Power BI Desktop to a multidimensional data source, that remote model was the only data source available for you.

Understanding the change

Power BI Desktop (December 2020 release) removes this long-standing limitation for live connections to Tabular. In the special case of connecting to a dataset published to Power BI Service and Azure Analysis Services (on-prem SSAS is not supported), you can switch from live connectivity to DirectQuery and add external data to build a composite model. This feature is very important because it allows business users to extend semantic models that could be sanctioned by someone else in the organization!

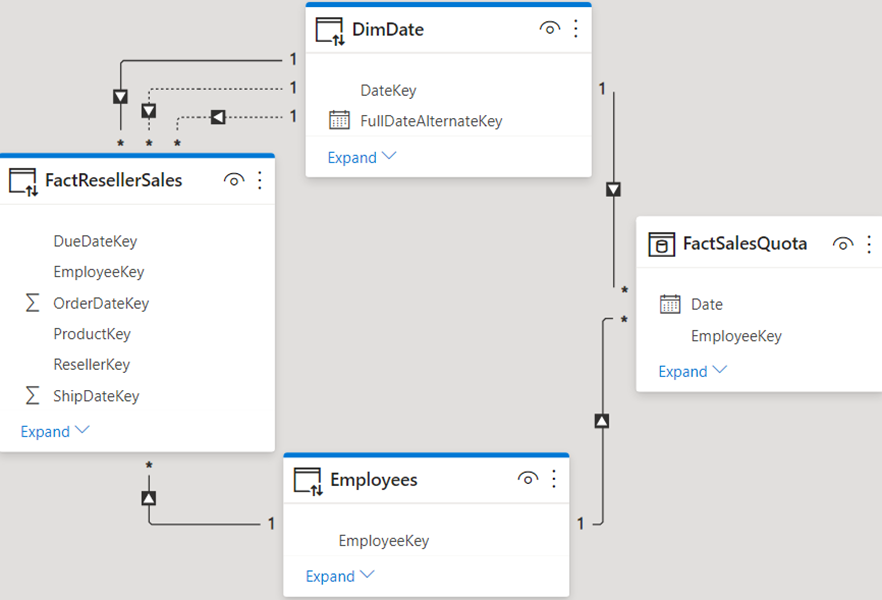
If the first connection you make is to the remote model then the connection will use Live Connect. The Power BI Desktop file will not store any metadata or data, expect for the connection string. The moment you use “Get Data” to connect to another source and accept the prompt, Power BI Desktop replaces permanently the live connection with a local DirectQuery layer and imports the metadata of the remote model. Even if you remove all external tables, you won’t be able to “undo” the change and switch back the file to Live Connect. In the diagram below, FactResellerSales, DimDate, and Employees tables are hosted in the remote model while FactSalesQuota is an external table that is imported (could be in DirectQuery mode).

What happens behind the scenes

In a nutshell, DirectQuery to Analysis Services Tabular is like other DirectQuery sources where DAX queries generated by Power BI are translated to native queries. However, in this case Power BI either sends the DAX queries directly to the remote model when possible or breaks them down into lower-level DAX queries. In the latter case, the DAX queries are executed on the remote model and then the results are combined in Power BI to return the result for the original DAX query. So, depending on the size of the tables involved in the join, this intermediate layer may negatively impact performance of visuals that mix fields from different data sources.

Applying your knowledge about composite models, you might attempt to configure the dimensions in dual storage, but you’ll find that this is not supported. Behind the scenes, Power BI handles the join automatically, so you do not need to set the storage mode to Dual. It’s interpreted as Dual internally. You can make metadata changes on top of the remote model. For example, you can format fields, create custom groups, implement your own measures, and even calculated columns (calculated columns are now evaluated at runtime and not materialized). The changes you make never affect the remote model. They are saved locally in the DirectQuery model.

Currently, row-level security (RLS) doesn’t propagate from the remote model to the other tables. For example, the remote model might allow salespersons to see only their sales data by applying RLS to the Employees table. However, the user will be allowed to see all the data in the FactSalesQuota table because it’s external to the remote model and RLS doesn’t affect it.


Teo Lachev
Prologika, LLC | Making Sense of Data
Microsoft Partner | Gold Data Analytics

logo

The Science of Counting

I’m watching the witness testimonies for election irregularities in Georgia (the state where I live). I’m shocked about how this election became such a mess and international embarrassment. United States spent 10 billion on the 2020 election. Georgia alone spent more than 100 million on some machines the security experts said can be hacked in minutes. If we add the countless number of manhours, investigations, and litigations, these numbers will probably double by the time the dust settles down.

What did we get back? Based on what I’ve heard, 50% of Americans believe this election is rigged, just like 50% believed so in 2016. The 2020 election added of course more options for abuse because of the large number of mail-in ballots. It’s astonishing how manual and complicated the whole process is, not to mention that each state does things differently. But the more human involvement and moving parts, the higher the attack vector and probability for intentional or unintentional mishandling due to “human nature”, improper training, or total disregard of rules. I casted an absentee ballot without knowing how it was applied.

So, your humble correspondent thinks that it’s about time to computerize voting. Where humans fall short, machines take over. Unless hacked, algorithms don’t make “mistakes”. How about a modern Federal Internet Voting system that can standardize voting in all states? If the Government can put together a system for our obligations to pay taxes, it should be able to do it for the right to vote. If the most advanced country can get a vaccine done in six months, we should be able to figure out how to count votes. Just like in data analytics, elections will benefit from a single version of truth. Despite the security concerns surrounding a web app, I believe it will be far more secure that this charade that’s going on right now. In this world where no one trusts anyone, we can’t apparently trust bureaucrats to do things right.

Other advantages:

  • Anybody can vote from any device so no vote “suppression”
  • Better authentication (face recognition and capture, cross-check with other systems, ML, etc.)
  • Vote confirmation
  • Ability to centralize security surveillance and monitoring by an independent committee
  • Report results in minutes
  • Additional options for analytics on post-election results
  • Save enormous amount of money and energy!

I’m just saying …

Atlanta MS BI and Power BI Group Meeting on December 7th

Please join us online for the next Atlanta MS BI and Power BI Group meeting on Monday, December 7th, at 6:30 PM.  Patrick LeBlanc (A Guy in the Cube) will share techniques to optimize your Power BI data models. For more details, visit our group page and don’t forget to RSVP (fill in the RSVP survey if you’re planning to attend).

Presentation:Optimizing the size of your model
Date:December 7th, 2020
Time6:30 – 8:30 PM ET
Place:Click here to join the meeting

Learn More | Meeting options

Overview:When working with your Power BI Data Model/Dataset there are certain that can be done to optimize the size of the model.  With that, there are certain thing that can be done that wreaks havoc on your Data Model.  In this session we will walk you through several things that can be done to ensure that your data model is optimize for the best performance.  We will discuss and demonstration how items such as data types, model properties, and DAX calculations and adversely affect the size of the model.  That’s just a small list of items, join the meeting to learn all the tips and tricks.
Speaker:Patrick LeBlanc is a currently a Principal Program Manager at Microsoft and a contributing partner to Guy in a Cube. Along with his 15+ years’ experience in IT he holds a Masters of Science degree from Louisiana State University. He is the author and co-author of five SQL Server books. Prior to joining Microsoft he was awarded Microsoft MVP award for his contributions to the community.  Patrick is a regular speaker at many SQL Server Conferences and Community events.
Prototypes without pizza:“Power BI Latest” by Teo Lachev

PowerBILogo

Understanding Power BI Endpoints

In its early days, Power BI introduced an endpoint to support Analyze in Excel (AIXL). Later, the “Power BI datasets” connector relied on this endpoint to support connecting to published datasets. The AIXL endpoint was never intended to support other clients. It has a few limitations, such as it doesn’t support long running requests and write operations. Also, it doesn’t support importing data as you’ve probably found when connecting to published datasets.

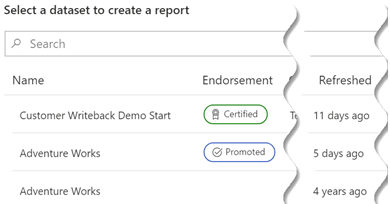
Later, Power BI Premium added the XMLA endpoint to support external clients connected to datasets in a premium capacity. If you’re on Premium, you should use the XMLA endpoint to connect external clients by using the Azure Analysis Services connector. Unfortunately, if you do so in PBI Desktop, “Get Data” won’t give you the nice UX that shows you which datasets are certified.

It will be nice if Microsoft adds a mechanism in the future where the client libraries will automatically take the new style of connection string (workspace + dataset name) and redirect to the AIXL endpoint if the dataset is hosted in a shared capacity or the XMLA endpoint if the dataset is in Premium. Or even better, support the XMLA endpoint for both shared and premium capacities.

In summary:

  • AIXL and PBI Desktop use the AIXL connections.
  • You should never use AIXL connection strings directly.
  • Business users should continue using the “Power BI datasets” connector.
  • Other external clients should use the XMLA endpoint to connect to a dataset in a premium capacity.

Updated Export Settings

A Happy Thanksgiving to all of you! I’m thankful for your interest in and support of my work.

I’m glad that Microsoft has recently updated the Power BI tenant export settings and thus mitigated the the complaints I had in my “A False Sense of Data Security” blog. Disabling the “Export to …” settings, which now applies also to paginated reports, no longer disables live connections to published datasets and features that depend on it, such as connecting to published datasets in Power BI Desktop, accessing the Power BI Premium XMLA endpoint, and Analyze in Excel. Instead, there is a clear distinction and  now there two separate settings that affect external connectivity (for XMLA connectivity, the XMLA Endpoint capacity setting must be enabled in Read-Only or Read-Write modes):

  • Allow live connections – This is a catch-all setting for allowing the live connectivity features.
  • Allow XMLA endpoints and Analyze in Excel with on-premises datasets — Microsoft felt that there should be a separate setting (besides “Allow live connections”) for connecting to on-prem datasets. However, just like disabling “Allow live connections”, this setting also effectively disables the Power BI Premium XMLA endpoint preventing other tools, such as Visual Studio or SSMS, to connect to published datasets.

Power BI Dynamic M Query Parameters – Another Opportunity Missed for DirectQuery Users

UPDATE 17-Feb-2022: Dynamic query parameters now support popular relational data sources, and I posted an updated blog.

I had recently a Power BI advisory engagement for a large ISV. They had many customers. and each customer data was hosted in its own database for security reasons, with all databases having an identical schema. Power BI reports had to connect using DirectQuery to avoid refreshing data (real-time BI). Naturally, the customer envisioned a single set of reports with the ability to switch the dataset connection to the respective database depending on the user identity and company association. In addition, they wanted to piggyback on the existing database security policies by having each visual call a stored procedure and pass the user identity as a dynamic parameter.

Can Power BI do this? Unfortunately, no. The main architectural issue is that although the model (VertiPaq) and query (Power Query) are bundled in Power BI Desktop (and in a single dataset when published), they are like two separate universes. Naturally, this is not an issue when data is imported, but it becomes important with DirectQuery. As it stands, the only communication between these two layers is when Power Query passes the data back to the model. You can define query parameters, but they are static, meaning that they must be specified on the dataset settings page in Power BI Service. In other words, query parameter can’t reference DAX constructs, such as USERPRINCIPALNAME(), and therefore can’t reference runtime conditions.

That’s why I initially rejoiced when Microsoft announced Dynamic M Query Parameters, a feature that just went into public preview in the Power BI Desktop October 2020 release. Unfortunately, a better name of this feature would have been Kusto Dynamic Parameters since the primary design intent was to support Azure Data Explorer (internally named Kusto). It doesn’t apply to DirectQuery connections to most relational databases.

Although there is no indication, Power BI has two types of connectors: native and M-based. Native connectors target most popular relational data sources: TSQL (Azure Database, SQL Server, Synapse), PLSQL (Oracle), Teradata and relational SAP Hana. Dynamic query parameters won’t work with native connectors. The rest (Microsoft provided and custom) are M-based. If an M connector supports DirectQuery, it should support dynamic query parameters too. For example, besides Azure Data Explorer, other M-based data source that supports DirectQuery and therefore dynamic parameters are Amazon Redshift, Showflake, and Google BigQuery.

I hope Microsoft will revamp this feature to support the popular relational databases and DAX functions, so we can address more involved DirectQuery scenarios and make parameters really dynamics.

Stop Using the Power BI Folder Connector

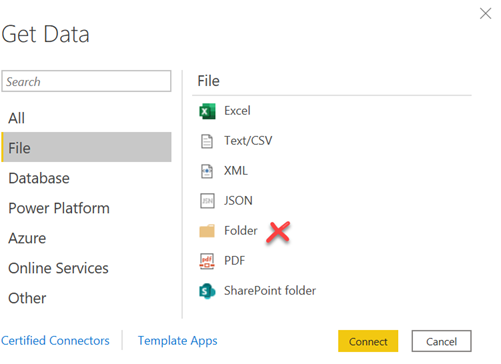
I know that it’s tempting to use the Folder connector to combine multiple files with the same schema and load them in Power BI Desktop with a few clicks – an idea promoted by Microsoft’s own Power BI Dashboard in a Day (DIAD) training.

But what happens if you want to automate the dataset refresh after uploading your model to Power BI Service? Suddenly, things don’t work so well anymore. The only option is to install a personal gateway on your laptop with all the issues surrounding it.

Instead, I recommend you upload files to Azure Data Lake Storage and use the Power BI Azure Data Lake Storage Gen2 connector. Setting this up will require some assistance from your friendly IT department to set up ADLS and grant you access, but they shouldn’t complain if they are serious about data governance.

Like the Folder connector, you can combine multiple files from an ADLS folder. Moreover, this deployment options offers several benefits over keeping files locally:

  1. Eliminates gateways.
  2. Allows files to be centralized and organized nicely in folders.
  3. Enables integration scenarios, such as a third-party system pushing files on a schedule.
  4. Provides secured access and supervision by IT.
  5. Supports CDM folders in case you ever want to go there, such as to load files from Power BI dataflows or Dynamics CRM.
  6. It’s a highly available, performant, and scalable.