Atlanta MS BI and Power BI Group Meeting on May 4th

MS BI fans, please join us online for the next Atlanta MS BI and Power BI Group meeting on Monday, May 4th, at 6:30 PM. Bill Anton will show you how to effectively apply time intelligence to your Power BI data models. For more details, visit our group page and don’t forget to RSVP (fill in the RSVP survey if you’re planning to attend).

Presentation:Power BI Time Intelligence – Beyond the Basics
Date:May 4th, 2020
Time6:30 – 8:30 PM ET
Place:Join Microsoft Teams Meeting

Learn more about Teams | Meeting options

Computer audio is recommended

Conference bridge number 1 605 475 4300, Access Code: 208547

Overview:Time-Intelligence refers to analyzing calculations and metrics across time and is the most common type of business intelligence reporting. Power BI has a lot of built in capabilities to help you get started but these alone are not always enough for most real-world solutions.

The key to mastering time-intelligence in Power BI is a good date table and understanding how to manipulate the filter context. This session will teach you how to do both!

In this (demo-heavy) session, we’ll quickly review Power BI’s built-in time intelligence capabilities and why you should avoid them! We’ll also cover the importance of a good date table, what attributes it should include, and how it can be leveraged to simplify complex time-intelligence calculations. Finally, we’ll breakdown a handful of the 40+ DAX time-intelligence functions, showing you how they work under the covers (hint: filter context) and how they can used in combination to accommodate complex business logic.

Speaker:Bill Anton is an independent consultant whose primary focus is designing and developing Data Warehouses and Business Intelligence solutions using the Microsoft BI stack. When he’s not working with clients to solve their data-related challenges, he can usually be found answering questions on the MSDN forums, attending PASS meetings, or writing blog posts over at byoBI.com.
Prototypes “without” pizza:Power BI latest features

PowerBILogo

Sentiment Analysis with Power BI

A recent ask from an airline company was to perform sentiment analysis on comments in surveys collected from their customers. Sentiment analysis is a machine learning task that requires natural language processing.

In Power BI, we have at least two ways to approach this requirement: Cognitive Services and custom code, such as by using the Python Natural Language Toolkit (NLTK).

This post compares the pros and cons of each option based on my impressions so far.

Cognitive ServicesPython
LicensingIncluded in premium or embedded capacity

or, provisioned separately with Azure subscription with Power BI Pro

Freely available
ProvisioningAlready provisioned with premium or embedded (need to enable AI workloads)Install Python

Install pandas, matplotlib, and nltk packages

Language detectionYesNo
Data refreshNo gateway requiredPersonal gateway required
Enhanced dataset metadataSupportedNot supported

Cognitive Services

Cognitive Services is an Azure PaaS cloud service that supports text analytics and image recognition. It’s automatically included in Power BI Premium or Embedded capacities (make sure that AI workloads are enabled in the capacity settings). If you organization doesn’t have Power BI Premium or Embedded, you can provision Cognitive Services in Azure (requires an Azure subscription) and then write a custom Power Query function to invoke its APIs, as demonstrated by this tutorial. If you provision Cognitive Services outside Power BI Premium,  you’ll be charged per transaction. In the case of Power BI, the number of transactions equates to the number of rows in your table. So, if you refresh five times a table with 1,000 rows and calculate the sentiment polarity score for each row, you’ll be charged for 5,000 transactions.

You can integrate Power BI with Cognitive Services in a Power BI dataflow or within Power Query in Power BI Desktop. The latter option requires specifying a premium or embedded capacity if you want to go code-free and use the Text Analytics feature (Home ribbon in Power Query). Otherwise, you must write M code as the above tutorial shows.

One CS feature that proved very useful is the automatic language detection. In my case, I had comments in different languages. When each row is processed, Power BI will send a “transaction” to Cognitive Services. If you leave the second parameter (language) of the API call to null, Cognitive Services will try to detect it on its own!

Refreshing data and rescoring do not require a Power BI gateway because Cognitive Services is a cloud service.

Python

When budget is tight or you can’t get help from IT to provision Cognitive Services, Python might come to the rescue. The main advantage of this option is that is free. But, you need at least a few lines of Python code (or much more if English is not the only language you need to support), as this article demonstrates. You must install Python (TIP: install it from python.org as Anaconda doesn’t work with Python scripts since there isn’t way to start the Anaconda environment before the script runs), configure Power BI for Python scripting, and install pandas, matplotlib, and nltk packages . A great feature of Power Query is that you can add a Python transformation that can call the Python script inside your Power Query transformation steps.

As far as I could tell, handling multiple languages is not an easy task with Python NLTK. You can easily detect the language, but there are no built-in dictionaries for any other language than English when performing sentiment analysis. In addition, when you publish your Power BI Desktop file with Python transformations, you need to set up a gateway. The enterprise gateway doesn’t support Python scripts so you must install a personal gateway on the machine that was used to develop the Power BI Desktop file.

As a last caveat, note that Power BI Desktop “Enhanced Dataset Metadata” feature (currently in preview) doesn’t support R and Python scripts yet. So, if Power Query Preview Pane works but you get an error when importing your data in Power BI Desktop, you’ve probably turned this feature on. To resolve, turn it off and then create a new Power BI Desktop file.

Virtual Power BI Dashboard in a Day (DIAD) on April 30

Register for my next online Power BI Dashboard in a Day (DIAD) workshop and hone your data analytics skills! Drive value for your organization and on the road to recovery after COVID-19. Attend from anywhere for only $199. I’ll teach you practical Power BI knowledge and data analytics skills that you can immediately apply to your job. See how Power BI can improve your usability and productivity even further.

Power BI Source Control

Question: How to put Power BI files under source control?

Workaround: Power BI Desktop does not currently support source control and it doesn’t have an Excel-like extensibility mechanism to let developers take from where Microsoft left off.

However, thanks to the enhanced dataset metadata (currently in preview), you can implement a rudimentary source control policy while waiting for third parties to fill in the void by using these steps:

  1. In Power BI Desktop, go to File, Options and settings, Options. In the “Preview features” tab, check “Store datasets using enhanced metadata format” if this feature is still in preview. Restart Power BI Desktop when asked.
  2. In Power BI Desktop, go to File, Save As and save the file as a Power BI Template (*.pbit) file. This removes the imported data which you don’t need for source control and keeps the file small.
  3. If you want to put all artifacts (reports, queries, data model) under source control, upload the entire file to your source control provider. However, if you want to compare and restore the model schema, you have more work left.
  4. In Windows Explorer, right-click the pbit file and extract its content using your favorite extractor, such as 7-Zip. If this doesn’t work, rename the file extension to *.zip (Power BI files are saved as archive zip files) and extract.
  5. The DataModelSchema file stores the model schema. I recommend you version control it separately so you can easily compare what changes have been made to the model (DataModelSchema is described in the same JSON schema as Analysis Services Tabular).
  6. If you want to restore to a previous version of the schema or make changes, simply change the DataModelSchema file, zip the content back to a *.pbit file.

Other options to get to the model schema:

  1. Use Tabular Editor which can open *.pbit files.
  2. Use SSMS to connect to the running instance of Power BI Desktop (you can use the DAX Studio to obtain the port the AS instance is listening on) and then script the database as CREATE.

Two Virtual Workshops to Learn the Power BI Platform

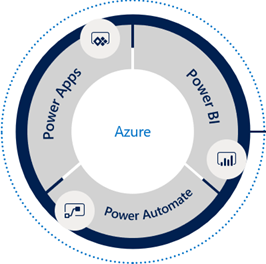
Take advantage of this exclusive opportunity to increase your data IQ from the comfort of your home wherever you are! Register today for my instructor-led digital training events and learn the Microsoft Power Platform consisting of Power BI, Power Apps, and Power Automate.

1-Day Power BI Dashboard in a Day (DIAD) Workshop

1-Day Application in a Day (AIAD) Workshop

The workshops will be conducted online. Login instructions will be sent to registered attendees before the event.


Atlanta MS BI and Power BI Group Meeting on April 6th

MS BI fans, the time has come for a virtual meeting. Please join us online for the next Atlanta MS BI and Power BI Group meeting on Monday, April 6th, at 6:30 PM. I’ll show you how business analysts can apply AutoML in Power BI Premium to create predictive models. For more details, visit our group page and don’t forget to RSVP (fill in the RSVP survey if you’re planning to attend).

Presentation:Bringing Predictive Analytics to the Business User with Power BI AutoML (Virtual Meeting)
Date:April 6th, 2020
Time6:30 – 8:30 PM ET
Place:Join Microsoft Teams Meeting

Learn more about Teams | Meeting options

Computer audio is recommended

Conference bridge number 1 605 475 4300, Access Code: 208547

Overview:With the growing demand for predictive analytics, Automated Machine Learning (AutoML) aims to simplify this process and democratize Machine Learning so business users can create their own basic predictive models. Join this presentation to learn how to apply AutoML in Power BI Premium to predict the customer probability to purchase a product. I’ll show you the end-to-end AutoML process, including:

·       Create a dataflow

·       Choose a field to predict

·       Choose a model type

·       Select input variables (features)

·       Train the model

·       Apply the model to new data

·       Bonus: Integrate Power BI with AzureML

Speaker:Through his Atlanta-based company Prologika (https://prologika.com), a Microsoft Gold Partner in Data Analytics, Teo Lachev helps organizations make sense of their most valuable asset: their data. His strategy formulation, trusted advisory and mentoring, design and implementation services empower clients to apply effectively data analytics in order to understand, improve, and transform their business processes. Teo has authored and co-authored several books on organizational and self-service data analytics, and he has been leading the Atlanta Microsoft BI and Power BI group since he founded it in 2010. Teo has been a Microsoft Most Valued Professional (MVP) Data Platform since 2004.
Prototypes without pizza:Power BI latest features

PowerBILogo