Prologika Newsletter Spring 2021


Amidst the COVID pandemic, the Houston Health Department (HHD) had another predicament to tackle. With lab results accumulating rapidly at one million cases per month, the vendor system they used for capturing and analyzing COVID data couldn’t keep up. In this newsletter, you’ll learn how Prologika implemented a BI solution powered by SQL Server and Power BI to solve technology challenges, and deliver fast and reliable insights.

Business Challenges

The vendor SQL Server database had large tables with normalized name-value pairs for each question and answer received from the patient, and for each investigation result. To facilitate reporting, the vendor system had scheduled ETL processes to extract data from the OLTP tables into denormalized tables. However, locking conflicts and large data volumes would crash the system and fail the ETL processes.

As a result, business analysts were not able to get timely data for reporting. HHD and the vendor tried to isolate the reporting loads by replicating the data to a reporting database but the issue with populating the denormalized tables remained

Solution

A good solution starts with a solid foundation. After assessing the current state and objectives, Prologika recommended and implemented the following architecture:
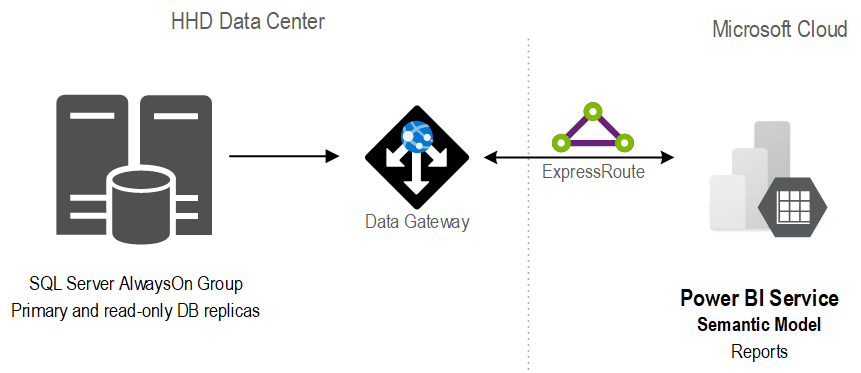
The stand-alone SQL database was replaced with an AlwaysOn availability group. Not only did this provide high availability, but it also isolated operational from reporting workloads.

In the client’s own words “we have compared the cluster server to the report server and cluster is vastly superior with regard to performance for regular queries. One simple run was 4x faster on cluster than the current report server. A much more complex run took four minutes on cluster and I stopped the same run on the report server after 87 minutes.”

Previously, data analysts would produce reports using different tools, ranging from SQL, Python, to Power BI reports. With scarce resources, HHD found it difficult to continue that path. Instead, Prologika implemented a semantic model that was hosted in Power BI.

Benefits

The new architecture and semantic model delivered the following benefits to HHD:

  • A single version of truth – Strategic data and business calculations were centralized on one place.
  • Fast insights – The Power BI reports crunching millions of rows were instantaneous.
  • Isolation – Report loads were isolated from the operational loads because the data was cached in the semantic model.
  • Standardization and centralization – Power BI became the reporting platform for delivering insights across the organization.


Teo Lachev
Prologika, LLC | Making Sense of Data
Microsoft Partner | Gold Data Analytics

logo

Solving RLS Gotchas

Scenario: You’ve created a beautiful, wide-open Tabular model. You use USERELATIONSHIP() to switch relationships on and off. Everything works and everyone is pleased. Then RLS sneaks in, such as when external users need access, and you must secure on some dimension table. You create a role, specify a row filter, test the role, and get greeted with:

The UseRelationship() and CrossFilter() functions may not be used when querying ‘<dimension table>’ because it is constrained by row-level security defined on ‘<dimension table>’ or related tables.

Analysis: There is a long-standing Tabular limitation that prevents USERELATIONSHIP for an added level of security which may be triggered even if USERELATIONSHIP doesn’t enable a relationship on the security propagation path. This is done to prevent information disclosure in case there is some other active relationship (since UseRelationship would disable security propagation across the other relationship). Unfortunately, the current design is “no inactive relationship, no problem”. A better option would have been to introduce a metadata table-based (or relationship-based) attribute to remove this rule.

Workaround: Since currently there is no magic switch you need to find a workaround depending on your specific case. For example, in one case where only external users were affected, I added a new set of measures. I didn’t change the original measures for two reasons: a) avoid re-testing the entire model and b) dynamic relationship always underperform materialized relationships. The new set could use INTERSECT (or TREATAS if you on SQL Server 2016+) to replace USERELATIONSHIP. For example, instead of:

USERELATIONSHIP(Policy[Branch Number], Division[Branch Number])

You could use:

INTERSECT(VALUES(Division[Branch Number]), VALUES(Policy[Branch Number]))

Note that you might not get exactly the same behavior because materialized and dynamic relationship differ in how the missing members are handled (see my blog “Propagating DAX BLANK() Over Relationships” to understand this better).

State Health Department Gains Reliable and Rapid COVID Insights

Amidst the pandemic, the Houston Health Department (HHD) had another predicament to tackle. With lab results accumulating rapidly at one million cases per month, the vendor system they used for capturing and analyzing COVID data couldn’t keep up. The SQL Server database had large tables with normalized name-value pairs for each question and answer received from the patient, and for each investigation result. Read our case study to learn how Prologika implemented a BI solution powered by SQL Server and Power BI to help HHD gain reliable and timely insights from COVID lab results.

Atlanta MS BI and Power BI Group Meeting on March 1st

Please join us online for the next Atlanta MS BI and Power BI Group meeting on Monday, March 1st, at 6:30 PM.  Your humble correspondent will discuss the business value of semantic models and implementation options for self-service BI and organizational BI. For more details, visit our group page.

Download the slide deck from here.

Presentation:Implementing Semantic Models
Date:March 1st, 2021
Time6:30 – 8:30 PM ET
Place:Microsoft Teams
Overview:A semantic model is a layer between the data source and end user. Data analysts create self-service semantic models with Power BI Desktop or Excel. BI developers implement organizational semantic models with SSDT, Tabular Editor, and PBI Desktop. Join this session to:

·       Learn what is a semantic model and how to choose between the self-service and organizational paths.

·       Understand the implementation options for self-service BI models and best modeling practices.

·       Find how organizational semantic models can help you achieve the “Discipline at the core, Flexibility at the Edge” tenant

·       Learn how to choose a hosting platform and tool for implementing organizational semantic models.

·       Learn how data analysts can extend organizational semantic models.

Speaker:Teo Lachev is a consultant, author, and mentor, with a focus on Microsoft BI. Through his Atlanta-based company Prologika (a Microsoft Gold Partner in Data Analytics and Data Platform) he designs and implements innovative solutions that bring tremendous value to his clients. Teo has authored and co-authored several books, and he has been leading the Atlanta Microsoft Business Intelligence group since he founded it in 2010. Teo is one of the few FastTrack Recognized Solution Architects by Microsoft for Power BI in the world. Microsoft has also acknowledged Teo’s expertise and contributions to the technical community by awarding him the Microsoft Most Valuable Professional (MVP) Data Platform status for 15 years.
Prototypes without pizza:Power BI Latest

PowerBILogo

Atlanta MS BI and Power BI Group Meeting on February 1st

Please join us online for the next Atlanta MS BI and Power BI Group meeting on Monday, February 1st, at 6:30 PM.  Paul Turley (MVP) will show you how to use Power Query to shape and transform data. For more details, visit our group page.

Presentation:Preparing, shaping & transforming Power BI source data
Date:February 1st, 2021
Time6:30 – 8:30 PM ET
Place:Click here to join the meeting

Learn More | Meeting options

Overview:In a business intelligence solution, data must be shaped and transformed. Your source data is rarely, if ever, going to be in the right format for analytic reporting. It may need to be consolidated into related fact and dimension tables, summarized, grouped or just cleaned-up before tables can be imported into a data model for reporting.

·       Where should I shape and transform data… At the source? In Power Query, or In the BI data model?

·       Where and what is Power Query? Understand how to get the most from this amazing tool and how to use it most efficiently in your environment.

·       Understand Query Folding and how this affects the way you prepare, connect and interact with your data sources – whether using files, unstructured storage, native SQL, views or stored procedures.

·       Learn to use parameters to manage connections and make your solution portable. Tune and organize queries for efficiency and to make them maintainable.

Speaker:Paul (Blog | LinkedIn | Twitter) is a Principal Consultant for 3Cloud Solutions (formerly Pragmatic Works), a Mentor and Microsoft Data Platform MVP. He consults, writes, speaks, teaches & blogs about business intelligence and reporting solutions. He works with companies around the world to model data, visualize and deliver critical information to make informed business decisions; using the Microsoft data platform and business analytics tools. He is a Director of the Oregon Data Community PASS chapter & user group, the author and lead author of Professional SQL Server 2016 Reporting Services and 14 other titles from Wrox & Microsoft Press.  He holds several certifications including MCSE for the Data Platform and BI.
Prototypes without pizza:Power BI Latest

PowerBILogo

Calculation Group Gotchas

The moment you add a calculation group to your model, Power BI sets DiscourageImplicitMeasures = True on the model. Although this property can trick you to be believe that they are still supported, you can’t create implicit measures, such as by dragging a numeric field on the report to summarize that field. That’s because implicit measures are created as inline calculations which calculation groups don’t support.

Also, there is a current issue where when you add a column from a calculation group to a filter, “Require single selection” is set to on and it can’t be changed. Therefore, you won’t be able to filter multiple calculation items, such as to present t only MTD, QTD, and YTD from a list of many items in your calculation group. As a workaround, you add a calculated column that flags the desired values and filter on it. You can vote to expedite the fix here.

Rogue Q&A Queries

I’ve noticed severe performance degradation after refreshing a Power BI Desktop model with some five million rows. The Power BI Desktop process showed a sustained 50-60 % utilization for minutes in the Windows Task Manager. I did a profiler trace and I saw expensive DAX queries like these:

EVALUATE SELECTCOLUMNS(FILTER(VALUES(‘Sales'[PONumber]),LEN(‘Sales'[PONumber])<=100),”valueColumn”,’Sales'[PONumber])

EVALUATE SELECTCOLUMNS(FILTER(VALUES(‘Sales'[SalesOrderNumber]),LEN(‘Sales'[SalesOrderNumber])<=100),”valueColumn”,’Sales'[SalesOrderNumber])

EVALUATE SELECTCOLUMNS(FILTER(VALUES(‘Sales'[InvoiceNumber]),LEN(‘Sales'[InvoiceNumber])<=100),”valueColumn”,’Sales'[InvoiceNumber])

As it turned out, Power BI Desktop autogenerates these queries when building a Q&A index. The 100-size limit is because Power BI wants to keep the index small. In addition, values that are longer than 100 characters are unlikely to be asked by the user. Why not check thd the maximum column value and skip the column? Power BI wants to skip instances that are too long but still index the remaining instances of the column.

To avoid this performance degradation when modeling on the desktop you could disable the Q&A feature. This will also disable smart narratives because they depend on Q&A.

To do this, go to the File, Options and Settings, Options, and turn off the Q&A option.

If Power BI Desktop is connected to a remote model, such as a published Power BI dataset, you’ll see also an option to create a local index. This option was added because Power BI needs to ask user permission to query data from remote sources, build the data index, and store it on user’s machine. By default, it’s disabled until the user explicitly turns on Q&A. For import models, as the data is already on user’s machine, Power BI doesn’t need to ask the permission to query data anymore. That’s why the option to build a local index is not applicable to models with imported data.

Disabling the Q&A in Power BI Desktop affects the local file only. When you publish the model, you reenable Q&A from the data settings if you want end users to use Q&A features. For remote models, if you leave the first option, “Turn on Q&A to ask …”, on, but disable the second option, “Create a local index….”, and publish the model to the service, then Q&A will be enabled in the service by default. That is, you don’t have to go to dataset settings to enable Q&A for that model. For import models, you have to disable the first option, and then after publishing the model to the service, you have to go to dataset settings to enable Q&A there.

Applied Power BI Book (6th Edition)

Happy New Year!

I’m excited to announce the availability of the sixth edition of my Applied Microsoft Power BI book! When the first edition was published  in January 2016, it was the first Power BI book at that time and it had less than 300 pages. Since then, I helped many companies adopt or transition to Power BI and taught hundreds of students. It’s been a great experience to witness the momentum surrounding Power BI and how the tool has matured over time. As a result, the book also got thicker and it almost doubled in size. However, I believe what’s more important is that this book provides systematic, yet dependent, view by showing what Power BI can do for four types of users (business users, analysts, pros, and developers).

To my understanding, this is the only Power BI book that gets annual revisions to keep it up to date with this ever changing technology! Because I had to draw a line somewhere, Applied Microsoft Power BI (6th edition) covers all features that are in preview or released by December 2020. As with my previous books, I’m committed to help my readers with book-related questions and welcome all feedback on the book discussion forum on the book page. While you are there, feel free to check out the book resources (sample chapter, front matter, and more). I also encourage you to follow my blog at https://prologika.com/blog and subscribing to my newsletter at https://prologika.com to stay on the Power BI latest.

Bring your data to life for the sixth time! Keep on reading and learning!