Atlanta MS BI and Power BI Group Meeting on February 6th (Lakehouse in an Hour)

Please join us for the next meeting on Monday, February 6th, at 6:30 PM ET.  Patrick LeBlanc (Principal Program Manager at Microsoft and Guy in a Cube) will show you how to implement a lakehouse with Delta lake, Azure Data Factory, and Synapse. For more details and sign up, visit our group page.

WE ARE RESUMING IN-PERSON MEETINGS AT THE MICROSOFT OFFICE IN ALPHARETTA. WE STRONGLY ENCOURAGE YOU TO ATTEND THE EVENT IN PERSON FOR BEST EXPERIENCE. PLEASE NOTE THAT GUESTS ENTERING MICROSOFT BUILDINGS IN THE U.S. MUST PROVIDE PROOF OF VACCINATION OR SELF-ATTEST WITH HEALTHCHECK (HTTPS://AKA.MS/HEALTHCHECK). ALTERNATIVELY, YOU CAN JOIN OUR MEETINGS ONLINE VIA MS TEAMS. WHEN POSSIBLE, WE WILL RECORD THE MEETINGS AND MAKE RECORDINGS AVAILABLE AT HTTPS://BIT.LY/ATLANTABIRECS. PLEASE RSVP ONLY IF COMING TO OUR IN-PERSON MEETING.

Presentation: Lakehouse in an Hour

Date: February 6th

Time: 6:30 – 8:30 PM ET

Place: Onsite and online

 ONSITE

Microsoft Office (Alpharetta)

8000 Avalon Boulevard Suite 900

Alpharetta, GA 30009

ONLINE

Click here to join the meeting

Overview: Join us for an action-packed demo-fueled session where we actually build a lake house from source to report in less than an hour. We will walk you through getting your data from your source system, building out your data lake using Delta, transforming your data with Data Flows, serving it with Serverless SQL Pool and in the end connecting it to Power BI! After this session you will be able to start using all of these technologies and make your Analytical environment a success!

Speaker: Patrick LeBlanc is a currently a Principal Program Manager at Microsoft and a contributing partner to Guy in a Cube. Along with his 15+ years’ experience in IT he holds a Masters of Science degree from Louisiana State University. He is the author and co-author of five SQL Server books. Prior to joining Microsoft he was awarded Microsoft MVP award for his contributions to the community. Patrick is a regular speaker at many SQL Server Conferences and Community events.

Sponsor: The Community (thank you for your donations!)

Prototypes with Pizza: Power BI latest news

PowerBILogo

Implementing “Generic” Percent of Grand Total in DAX

Suppose you need to calculate a percentage of grand total measure. Easy, you can use the Power BI “Show value as” without any DAX, right? Now suppose that you have 50 Table visuals and each of them require the same measure to be shown as a percentage of total. Although it requires far more clicks, “Show value as” is still not so bad for avoiding the DAX rabbit hole. But what about if you need this calculation in another measure, such as to implement a weighted average? Now, you can’t reference the Microsoft-generated field because it’s not implemented as a measure.

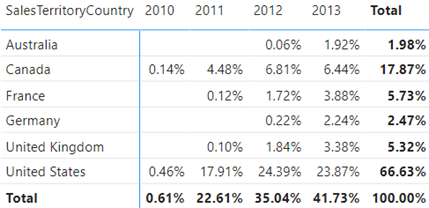
That’s exactly the scenario I faced while working on a financial report, although at the end I followed another approach to calculate the weighted average that didn’t require a percentage of total. Anyway, the question remains. Is there a way to implement a “generic” percent of grand total for a given measure that will work irrespective of what dimensions are used in a Table or Matrix visuals? Consider the following simple report.

We want to show sales as a percentage of total irrespective of what dimension(s) are used in the report. Typically, to implement percentage of total measures you’d implement a DAX explicit measure that overwrites the filter context, such as:

% SalesAmount =
VAR _TotalSales = CALCULATE(SUM(ResellerSales[SalesAmountBase]), ALL('Product'))
RETURN
DIVIDE (ResellerSales[SalesAmount], _TotalSales)

This measure uses the ALL function to remove the filter from the Product table to calculate the sales across any field in that table. But we want this measure to work even if fields from other tables are used as dimensions.

Enter the magical ALLSELECTED function. From the documentation, ALLSELECTED “removes context filters from columns and rows in the current query, while retaining all other context filters or explicit filters”, which is exactly what’s needed. That’s because we want to ignore the context from fields used in the visual but apply other filters, such as slicers and visual/page/report filters, and cross filtering from other visuals.

And so, the formula becomes:

% SalesAmount =
VAR _TotalSales = CALCULATE(SUM(ResellerSales[SalesAmountBase]), ALLSELECTED())
RETURN
DIVIDE (ResellerSales[SalesAmount], _TotalSales)

And that’s all to it except if you need a percentage of column total in a Matrix visual that has a field in the Columns bucket. In this case, ALLSELECTED will ignore not only the dimensions on rows but also dimensions on columns. Then, the net effect will be a generic measure that calculates the percent of grand total instead of column total.

By the way, if you use the “Show value as” built-in feature and capture the query behind the visual, you’ll see that Microsoft follows a rather complicated way to calculate it to handle this scenario. Specifically, the visual generates two queries, where the first computes the visual totals and the second computes the percentage of total.

Solving iPad Issues with Power BI Secure Embed

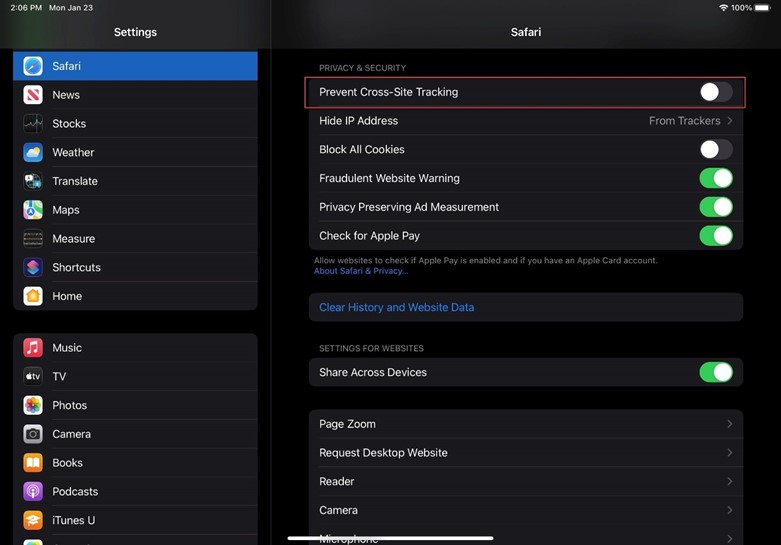
Scenario: You have an intranet web portal and use the Power BI secure embed feature (from the report menu, File->Embed report->Website or portal) to embed a report. However, the report doesn’t render on iPad and iPhone devices. Instead, the user is perpetually asked to authenticate  with Power BI.

Solution: Apple has started preventing cross-site cookies to tighten up security. To resolve this horrible issue, each user must turn off this feature. On their iPad or iPhone device, go to Settings > your browser app, such as Safari or Chrome, and set Present Cross-Site Tracking to Off (assuming you are using Safari to render the web page).