More and more organizations are switching to Microsoft Teams mostly for online meetings. However, Microsoft Teams can deliver much more than that and it will be unjust to compare it with other popular meetings apps. What Microsoft has done with Teams is amazing! Now that I got to study and program Microsoft Teams, I have found it a powerful and extensible platform. For example, Microsoft has provided add-ons for common verticals, such as Teams for Education. Microsoft Teams can be further enriched with apps and can be used to centralize all these Excel spreadsheets that are floating around. And the best of it: most of the Microsoft Teams data is exposed via a single data source: Microsoft Graph API, with the caveat that it is not that easy to get the data out.
I’ve added a new case study “Public School District Gets Insights from Microsoft Teams” that shows how Prologika helped one of the largest public school districts in the Atlanta Metro area to derive insights from Teams. They struggled for a long time trying to get the necessary data from Microsoft Teams to analyze how effectively teachers and students utilize Microsoft Teams in these challenging times. Prologika developed a custom app to extract the required data by calling the Microsoft Graph APIs. The key solution benefits were:
Automated daily retrieval of Teams data
Enabled a digital feedback loop to learn from the gathered insights and improve operations
Ability to analyze educational data by various perspectives (school, class, teacher, student, assignments, submissions, and events)
https://prologika.com/wp-content/uploads/2016/01/logo.png00Prologika - Teo Lachevhttps://prologika.com/wp-content/uploads/2016/01/logo.pngPrologika - Teo Lachev2020-05-25 17:20:442020-05-25 17:20:44Analyzing Microsoft Teams Data
The Power BI image-rendering visualizations, such as Table or Card, expect image links to public servers hosting the images with anonymous permissions. This has obvious shortcomings. Can we load images from a database or Power BI data table? You bet, as Jason Thomas has demonstrated a long time ago. Here are the steps I followed to show the images from the Production.ProductPhoto table in the AdventureWorks2012 (or later) database. If you want to embed a few images into a Power BI data table (instead of an external database), you can convert them manually to Base64 using any of the online image converters, such as https://codebeautify.org/image-to-base64-converter and embed the resulting string into a Power BI data table (the Enter Data feature). Gerhard Brueckl takes this one step further by showing you how to automate the base64 conversion with many images.
Import the table with the image column as usual in Power BI.
In Power Query, change the data type of the image column to Text.
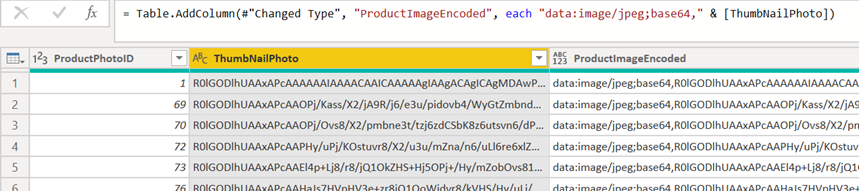
Add a new custom column that prefixes the base64 string with “data:image/jpeg;base64,” (not the comma at the end) for jpeg images or “data:image/png;base64,” for png.
= Table.AddColumn(#”Changed Type”, “ProductImageEncoded”, each “data:image/jpeg;base64,” & [ThumbNailPhoto]).
The ProductImageEncoded column below shows what the final Power Query transformation should look like. Click Close & Apply to import the table in the data model as you’re done with the transformation part.
In Power BI Desktop, select the ProductImageEncoded field in the Fields pane. Assuming the new ribbon, in the Column Tools ribbon, change the field category to Image URL.
Add the ProductImageEncoded field to a Table, Card, Multicard, or Slicer visuals.
https://prologika.com/wp-content/uploads/2016/01/logo.png00Prologika - Teo Lachevhttps://prologika.com/wp-content/uploads/2016/01/logo.pngPrologika - Teo Lachev2020-05-11 17:16:182020-05-11 17:16:18Showing Database Images in Power BI and Tabular
A customer reported that a Power BI date filter/slicer set to a specific date in Date dimension, let’s say April 24, 2020, doesn’t return some rows from the fact table that match that date. Upon some digging, the data was imported from Dynamics CRM and the source date column had UTC time. Power Query showed Date/Time/Timezone as a data type. However, the developer has converted the corresponding field in the model to the Power BI Date data type to remove the time portion. And indeed, the Data View would show that date as April 24, 2020 (without the time portion). So, why no match?
The xVelocity storage engine (the storage engine behind Power BI and Analysis Services Tabular) has only one data type for dates: DateTime. If you convert the field in the data model to Date, it still keeps the time portion (UTC or not) and it doesn’t change the column storage. It just changes to the column formatting to show the date only.
To get rid off the time portion, cast to Date in the data source (e.g. in a wrapper SQL view) or change the data type of the column in Power Query to Date. This will “remove” the time portion. In reality, xVelicity will convert the time to midnight.
https://prologika.com/wp-content/uploads/2016/01/logo.png00Prologika - Teo Lachevhttps://prologika.com/wp-content/uploads/2016/01/logo.pngPrologika - Teo Lachev2020-05-10 21:05:012020-05-10 21:05:01Power BI Time Adventures
MS BI fans, please join us online for the next Atlanta MS BI and Power BI Group meeting on Monday, May 4th, at 6:30 PM. Bill Anton will show you how to effectively apply time intelligence to your Power BI data models. For more details, visit our group page and don’t forget to RSVP (fill in the RSVP survey if you’re planning to attend).
Conference bridge number 1 605 475 4300, Access Code: 208547
Overview:
Time-Intelligence refers to analyzing calculations and metrics across time and is the most common type of business intelligence reporting. Power BI has a lot of built in capabilities to help you get started but these alone are not always enough for most real-world solutions.
The key to mastering time-intelligence in Power BI is a good date table and understanding how to manipulate the filter context. This session will teach you how to do both!
In this (demo-heavy) session, we’ll quickly review Power BI’s built-in time intelligence capabilities and why you should avoid them! We’ll also cover the importance of a good date table, what attributes it should include, and how it can be leveraged to simplify complex time-intelligence calculations. Finally, we’ll breakdown a handful of the 40+ DAX time-intelligence functions, showing you how they work under the covers (hint: filter context) and how they can used in combination to accommodate complex business logic.
Speaker:
Bill Anton is an independent consultant whose primary focus is designing and developing Data Warehouses and Business Intelligence solutions using the Microsoft BI stack. When he’s not working with clients to solve their data-related challenges, he can usually be found answering questions on the MSDN forums, attending PASS meetings, or writing blog posts over at byoBI.com.
Prototypes “without” pizza:
Power BI latest features
https://prologika.com/wp-content/uploads/2016/01/logo.png00Prologika - Teo Lachevhttps://prologika.com/wp-content/uploads/2016/01/logo.pngPrologika - Teo Lachev2020-04-27 09:13:102021-02-17 01:01:41Atlanta MS BI and Power BI Group Meeting on May 4th
A recent ask from an airline company was to perform sentiment analysis on comments in surveys collected from their customers. Sentiment analysis is a machine learning task that requires natural language processing.
In Power BI, we have at least two ways to approach this requirement: Cognitive Services and custom code, such as by using the Python Natural Language Toolkit (NLTK).
This post compares the pros and cons of each option based on my impressions so far.
Cognitive Services
Python
Licensing
Included in premium or embedded capacity
or, provisioned separately with Azure subscription with Power BI Pro
Freely available
Provisioning
Already provisioned with premium or embedded (need to enable AI workloads)
Install Python
Install pandas, matplotlib, and nltk packages
Language detection
Yes
No
Data refresh
No gateway required
Personal gateway required
Enhanced dataset metadata
Supported
Not supported
Cognitive Services
Cognitive Services is an Azure PaaS cloud service that supports text analytics and image recognition. It’s automatically included in Power BI Premium or Embedded capacities (make sure that AI workloads are enabled in the capacity settings). If you organization doesn’t have Power BI Premium or Embedded, you can provision Cognitive Services in Azure (requires an Azure subscription) and then write a custom Power Query function to invoke its APIs, as demonstrated by this tutorial. If you provision Cognitive Services outside Power BI Premium, you’ll be charged per transaction. In the case of Power BI, the number of transactions equates to the number of rows in your table. So, if you refresh five times a table with 1,000 rows and calculate the sentiment polarity score for each row, you’ll be charged for 5,000 transactions.
You can integrate Power BI with Cognitive Services in a Power BI dataflow or within Power Query in Power BI Desktop. The latter option requires specifying a premium or embedded capacity if you want to go code-free and use the Text Analytics feature (Home ribbon in Power Query). Otherwise, you must write M code as the above tutorial shows.
One CS feature that proved very useful is the automatic language detection. In my case, I had comments in different languages. When each row is processed, Power BI will send a “transaction” to Cognitive Services. If you leave the second parameter (language) of the API call to null, Cognitive Services will try to detect it on its own!
Refreshing data and rescoring do not require a Power BI gateway because Cognitive Services is a cloud service.
Python
When budget is tight or you can’t get help from IT to provision Cognitive Services, Python might come to the rescue. The main advantage of this option is that is free. But, you need at least a few lines of Python code (or much more if English is not the only language you need to support), as this article demonstrates. You must install Python (TIP: install it from python.org as Anaconda doesn’t work with Python scripts since there isn’t way to start the Anaconda environment before the script runs), configure Power BI for Python scripting, and install pandas, matplotlib, and nltk packages . A great feature of Power Query is that you can add a Python transformation that can call the Python script inside your Power Query transformation steps.
As far as I could tell, handling multiple languages is not an easy task with Python NLTK. You can easily detect the language, but there are no built-in dictionaries for any other language than English when performing sentiment analysis. In addition, when you publish your Power BI Desktop file with Python transformations, you need to set up a gateway. The enterprise gateway doesn’t support Python scripts so you must install a personal gateway on the machine that was used to develop the Power BI Desktop file.
As a last caveat, note that Power BI Desktop “Enhanced Dataset Metadata” feature (currently in preview) doesn’t support R and Python scripts yet. So, if Power Query Preview Pane works but you get an error when importing your data in Power BI Desktop, you’ve probably turned this feature on. To resolve, turn it off and then create a new Power BI Desktop file.
https://prologika.com/wp-content/uploads/2016/01/logo.png00Prologika - Teo Lachevhttps://prologika.com/wp-content/uploads/2016/01/logo.pngPrologika - Teo Lachev2020-04-22 17:45:412020-04-22 17:47:56Sentiment Analysis with Power BI
Question: How to put Power BI files under source control?
Workaround: Power BI Desktop does not currently support source control and it doesn’t have an Excel-like extensibility mechanism to let developers take from where Microsoft left off.
However, thanks to the enhanced dataset metadata (currently in preview), you can implement a rudimentary source control policy while waiting for third parties to fill in the void by using these steps:
In Power BI Desktop, go to File, Options and settings, Options. In the “Preview features” tab, check “Store datasets using enhanced metadata format” if this feature is still in preview. Restart Power BI Desktop when asked.
In Power BI Desktop, go to File, Save As and save the file as a Power BI Template (*.pbit) file. This removes the imported data which you don’t need for source control and keeps the file small.
If you want to put all artifacts (reports, queries, data model) under source control, upload the entire file to your source control provider. However, if you want to compare and restore the model schema, you have more work left.
In Windows Explorer, right-click the pbit file and extract its content using your favorite extractor, such as 7-Zip. If this doesn’t work, rename the file extension to *.zip (Power BI files are saved as archive zip files) and extract.
The DataModelSchema file stores the model schema. I recommend you version control it separately so you can easily compare what changes have been made to the model (DataModelSchema is described in the same JSON schema as Analysis Services Tabular).
If you want to restore to a previous version of the schema or make changes, simply change the DataModelSchema file, zip the content back to a *.pbit file.
Other options to get to the model schema:
Use Tabular Editor which can open *.pbit files.
Use SSMS to connect to the running instance of Power BI Desktop (you can use the DAX Studio to obtain the port the AS instance is listening on) and then script the database as CREATE.
https://prologika.com/wp-content/uploads/2016/01/logo.png00Prologika - Teo Lachevhttps://prologika.com/wp-content/uploads/2016/01/logo.pngPrologika - Teo Lachev2020-04-12 19:40:582020-04-12 19:40:58Power BI Source Control
MS BI fans, the time has come for a virtual meeting. Please join us online for the next Atlanta MS BI and Power BI Group meeting on Monday, April 6th, at 6:30 PM. I’ll show you how business analysts can apply AutoML in Power BI Premium to create predictive models. For more details, visit our group page and don’t forget to RSVP (fill in the RSVP survey if you’re planning to attend).
Presentation:
Bringing Predictive Analytics to the Business User with Power BI AutoML (Virtual Meeting)
Conference bridge number 1 605 475 4300, Access Code: 208547
Overview:
With the growing demand for predictive analytics, Automated Machine Learning (AutoML) aims to simplify this process and democratize Machine Learning so business users can create their own basic predictive models. Join this presentation to learn how to apply AutoML in Power BI Premium to predict the customer probability to purchase a product. I’ll show you the end-to-end AutoML process, including:
· Create a dataflow
· Choose a field to predict
· Choose a model type
· Select input variables (features)
· Train the model
· Apply the model to new data
· Bonus: Integrate Power BI with AzureML
Speaker:
Through his Atlanta-based company Prologika (https://prologika.com), a Microsoft Gold Partner in Data Analytics, Teo Lachev helps organizations make sense of their most valuable asset: their data. His strategy formulation, trusted advisory and mentoring, design and implementation services empower clients to apply effectively data analytics in order to understand, improve, and transform their business processes. Teo has authored and co-authored several books on organizational and self-service data analytics, and he has been leading the Atlanta Microsoft BI and Power BI group since he founded it in 2010. Teo has been a Microsoft Most Valued Professional (MVP) Data Platform since 2004.
Prototypes without pizza:
Power BI latest features
https://prologika.com/wp-content/uploads/2016/01/logo.png00Prologika - Teo Lachevhttps://prologika.com/wp-content/uploads/2016/01/logo.pngPrologika - Teo Lachev2020-04-02 21:19:322021-02-17 01:01:40Atlanta MS BI and Power BI Group Meeting on April 6th
I helped an ISV a while back with their BI model design. They purchased a data transformation tool for $5,200/year because it’s “simple to use” (the tool was designed for self-service data transformation tasks by business analysists) and “relatively inexpensive”. The idea was to run the tool manually every time they have new data, import data from text files, transform, and output the data in another set of files, and then load the transformed data in Power BI. However, as it typically happens, the data transformation complexity quickly outgrew this approach. What did the ISV learn along the way?
Stage the data – Although it’s tempting to do transformations on the fly, data typically must be staged so you can query and manipulate it. This is also required to compare the input dataset with the target dataset and take care of things like Type 2 slowly changing dimensions that may sneak in unexpected.
Get a relational database – At much lower price point of purchasing a “user-friendly” ETL tool that does transforms only, the ISV could have bought a scalable SQL Server Standard Edition priced at $1,859 per core (or $7,500 for four cores). Mind you that this is a perpetual license that will typically last you 2-3 years until it’s time for upgrade. And they must pay only for production use (remember that on-prem SQL Server is free for dev and test). Or, they could have opted for an Azure SQL Database and pay as they go (Microsoft gives away $120,000 as Azure Cloud credits for qualifying startups for two years). Or, if they are really under budget and don’t have large data volumes, they could have gone with the free SQL Server Express edition.
Use the ELT pattern – What happens when you outgrow the capabilities of the “user-friendly” tool and you must migrate to a professional tool, like SSIS or ADF? Start over. You don’t want to do this, trust me, because more than 60% of the effort to build a BI solution typically goes into data prep. Personally, I’m a big fan of the ELT pattern (see my blog “3 Techniques to Save BI Implementation Effort” for more info on this pattern) that relies heavily on T-SQL and stored procedures. If you go ELT, the tool choice becomes irrelevant as you use it only to orchestrate data tasks. For example, you use Control Flow and very simple Data Flow (just a simple source-destination data flow to stage data) in SSIS. And as a bonus, if one day you migrate to Azure Synapse, you’ll find that it recommends ELT too. Since they wanted to run ETL occasionally, they could have used Visual Studio Community Edition and the SSIS extension. Or, they could have gone completely free by using an open-source ETL tool, like Talend.
When evaluating tools, cost is not the only factor. Your design must be flexible and capable of accommodating changes which are sure to happen.
https://prologika.com/wp-content/uploads/2016/01/logo.png00Prologika - Teo Lachevhttps://prologika.com/wp-content/uploads/2016/01/logo.pngPrologika - Teo Lachev2020-03-30 17:39:502020-03-30 17:39:50How Much Are You Really Saving?
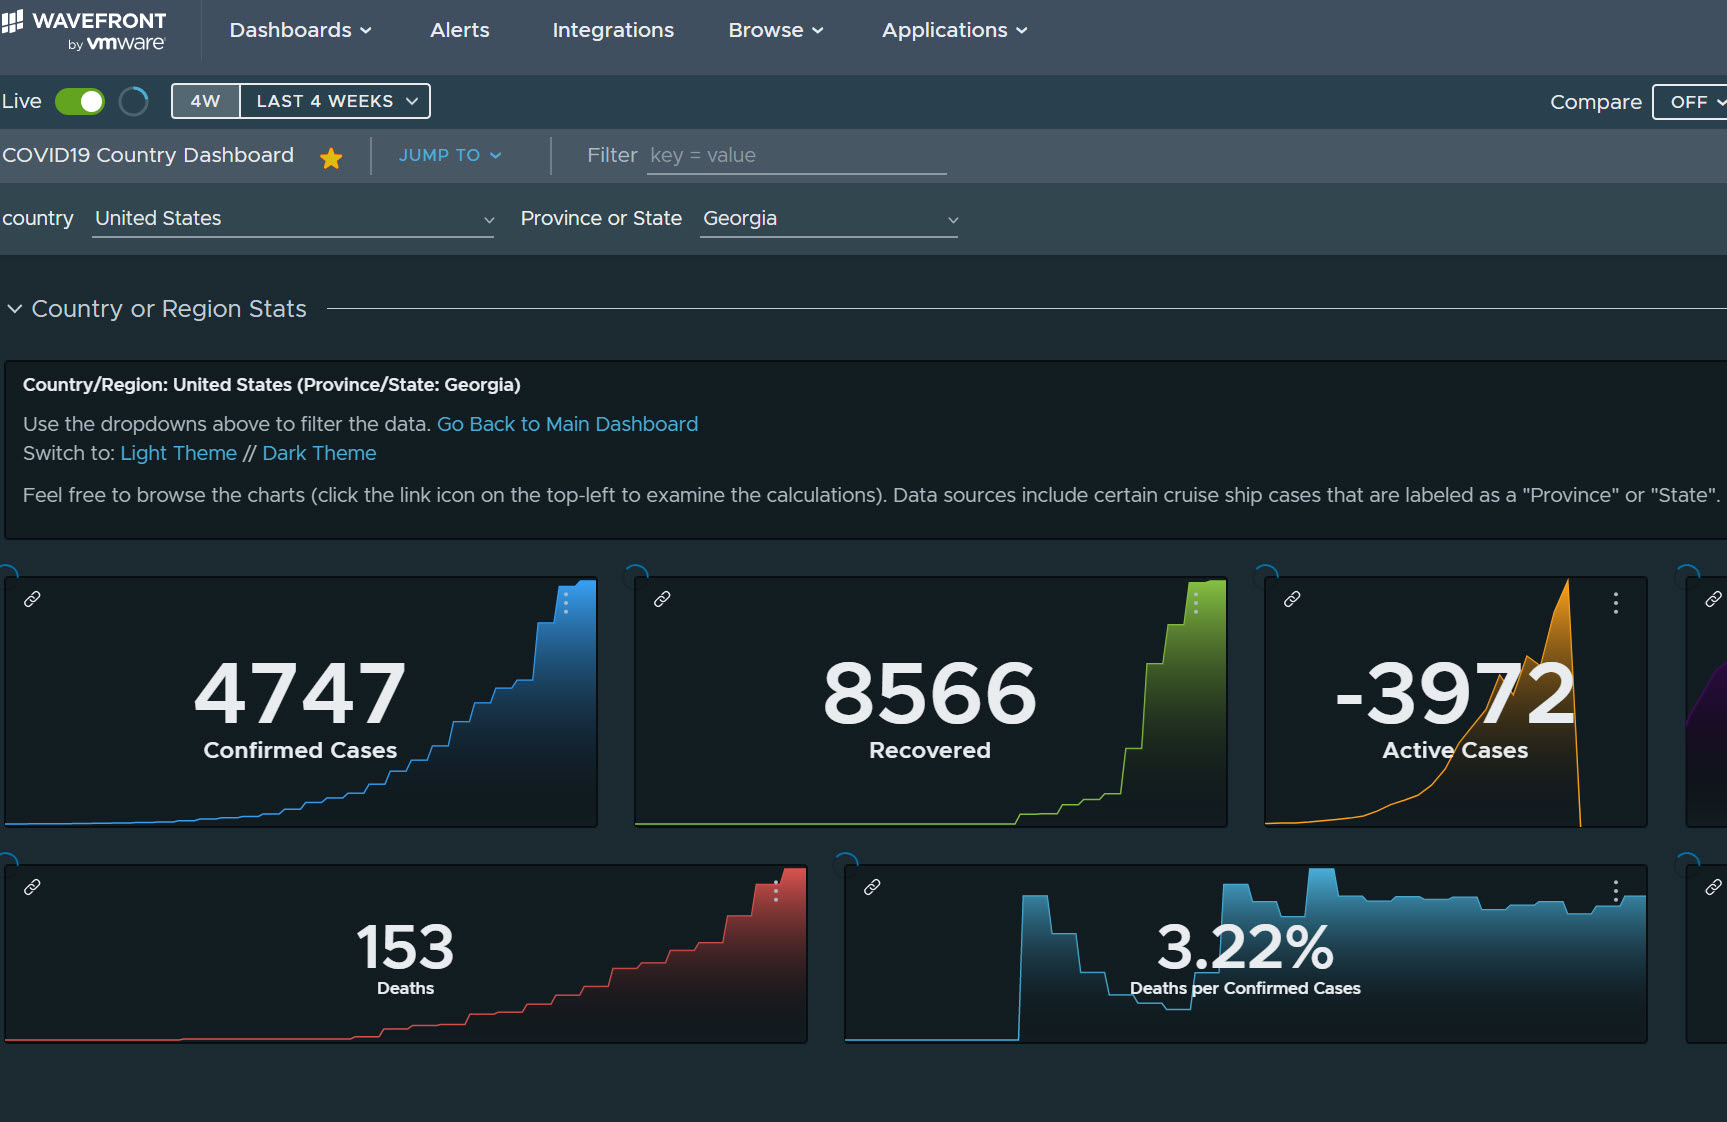
I’ve seen various reports designed to track COVID-19. I personally like the Microsoft Bing tracker (https://www.bing.com/covid). Not only does the report track the current counts, but it also shows a trend over time. It even goes down to a county level (the trend is not available at that level)! And it’s very fast. As good as it is, this is one report I hope I don’t have to use for long… Stay healthy!
As it stands, Power Apps doesn’t offer an easy way to get to the app source code. Yet, there are scenarios where this could be useful, including:
Putting the app source under source control when the Power Apps version history is not enough. Currently, Power Apps doesn’t integrate with source code repos, such as GitHub.
Finding references to an item. For example, I’ve referenced a collection in the wrong property, and I couldn’t find what triggered the collection load on the app startup. Since Power Apps doesn’t currently include dependency analysis for collections, I wanted to search the source code to find all references to it.
Here is the fastest way to get to the app source code:
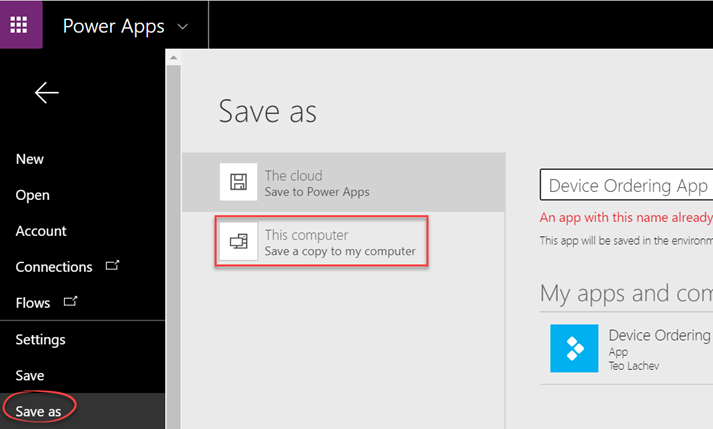
Open the app in edit mode and click Save As.
Choose “This computer” and click Download to download the app as a *.msapp file
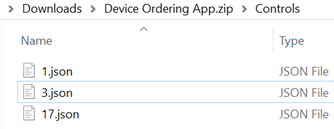
Rename the extension of the downloaded file to zip. Double click the zip file.
In my case, the exported app has three *.json files in the Controls folder. The interesting code is in the largest json file: 3.json.
Open this file in your favorite JSON editor and this is how we get to the app source code.
https://prologika.com/wp-content/uploads/2016/01/logo.png00Prologika - Teo Lachevhttps://prologika.com/wp-content/uploads/2016/01/logo.pngPrologika - Teo Lachev2020-03-26 20:58:372020-03-26 20:58:37Getting to Power Apps Source Code