A recent engagement required replicating some DW tables from Google BigQuery to a Fabric Lakehouse. We considered the Fabric mirroring feature (back then in private preview, now publicly available) and learned some lessons along the way:
1. 400 Error during replication configuration – Caused by attempting to use a read-only GBQ dataset that is linked to another GBQ dataset but the link was broken.
2. Internal System Error – Again caused by GBQ linked datasets which are read-only. Fabric mirroring requires GBQ change history to be enabled on tables so that it can track changes and only mirror incremental changes after first initial load.
3 (Showstopper) The two permissions that raised security red flags are bigquery.datasets.create and bigquery.jobs.create. To grant those permissions, you must assign one of these BigQuery roles:
• BigQuery Admin
• BigQuery Data Editor
• BigQuery Data Owner
• BigQuery Studio Admin
• BigQuery User
All these roles grant other permissions and the client was cautious about data security. At the end, we end up using a nightly Fabric Copy Job to replicate the data.
In summary, the Fabric Google BigQuery built-in mirroring could be useful for real-time data replication. However, it relies on GBQ change history which requires certain permissions. Kudos to Microsoft for their excellent support during the private preview.
Atlanta BI fans, please join us in person for our next meeting on Thursday, October 9th (note that we are meeting on Thursday for this meeting) at 18:30 ET. Sukhwant (Senior Product Manager, Microsoft) will explain why you should consider Fabric SQL databases. And your humble correspondent will walk you through some of the latest Power BI and Fabric enhancements. For more details and sign up, visit our group page.
Delivery: In-person Level: Intermediate Food: Pizza and drinks will be provided
Agenda:
18:15-18:30 Registration and networking
18:30-19:00 Organizer and sponsor time (news, Power BI latest, sponsor marketing)
19:00-20:15 Main presentation
20:15-20:30 Q&A
Overview: Microsoft Fabric is an all-in-one analytics platform, right? Wrong! With the introduction of SQL databases last year, we now have an all-in-one data platform. During this session you will hear directly from the product team about why we added SQL databases to Fabric, who should be using them, how this is different from Azure SQL databases, how to get started through an end-to-end demo, and the integration story with the rest of the platform.
If you’re a DBA that’s been trying to move applications for running SQL or a business user with limited database skills and no DBAs to be found, you’ll want to hear all about this exciting new offering that is simple, automated, and optimized for AI.
Speaker: Sukhwant has served as a Product Manager at Microsoft for the past few development cycles. During this time, she’s focused on the entire product management lifecycle, from working with development teams and user experience to collaborating with cross-functional teams to drive customer satisfaction in ensuring our products not only meet but exceed customer expectations.
Before joining Microsoft, she held various full-time/contracting roles as a technology leader for over two decades in software lifecycle development, system integration and enterprise architecture design. Her expertise extends to Data Strategy, Analytics, and Web Content Management. Throughout her career, she has successfully led numerous projects, both small and large, from inception through to implementation. She is a proponent of the servant-leader philosophy, which aims to continuously improve and empower those she works with.
Sponsor: At CloudStaff.ai, we’re making work MORE. HUMAN. We believe in the power of technology to enhance human potential, not replace it. Our innovative AI and automation solutions are designed to make work easier, more efficient, and more meaningful. We help businesses of all sizes streamline their operations, boost productivity, and solve real-world challenges. Our approach combines cutting-edge technology with a deep understanding of human needs, creating solutions that work the way people do! https://cloudstaff.ai
https://prologika.com/wp-content/uploads/2016/01/logo.png00Prologika - Teo Lachevhttps://prologika.com/wp-content/uploads/2016/01/logo.pngPrologika - Teo Lachev2025-10-03 12:22:122025-10-03 12:22:12Atlanta Microsoft BI Group Meeting on October 9th (Everything You Want to Know About SQL Databases in Fabric)
Atlanta BI fans, please join us in person for our next meeting on Monday, September 8th at 18:30 ET. Jeff Levy (Data Architect @ Protiviti) will show us how to implement Azure DevOps for data engineering projects in Microsoft Fabric. And your humble correspondent will walk you through some of the latest Power BI and Fabric enhancements. For more details and sign up, visit our group page.
Delivery: In-person Level: Intermediate Food: Pizza and drinks will be provided
Agenda:
18:15-18:30 Registration and networking
18:30-19:00 Organizer and sponsor time (news, Power BI latest, sponsor marketing)
19:00-20:15 Main presentation
20:15-20:30 Q&A
Overview: This session explores how to implement Azure DevOps for data engineering projects in Microsoft Fabric. You’ll learn the following:
Version Control Lakehouse assets (Pipelines / Notebooks / SQL Objects)
Manage environments with reusable YAML templates
Apply CI/CD Practices via the DevOps Build and Release Pipelines
The session is ideal for data engineers and DevOps practitioners aiming to bring agility, consistency, and governance to Fabric-based solutions.
Speaker: With over 12 years of expertise in designing, implementing, and optimizing data warehouse solutions, Jeff Levy (Data Architect @ Protiviti) is a seasoned Data Warehouse Architect specializing in SQL Server and Azure ecosystems. He has a proven track record of transforming complex data requirements into scalable, high-performance architectures that empower data-driven decision-making. These solutions have leveraged the full capabilities of Azure technologies, such as Azure Synapse Analytics, Databricks, and Microsoft Fabric. With a deep understanding of SQL, data modeling, and ETL processes, he has delivered many scalable and economic solutions to fit client needs. Jeff has worked across many verticals including Healthcare, Telecom and Retail / Consumer Product Goods (CPG)
Sponsor: Protiviti
https://prologika.com/wp-content/uploads/2016/01/logo.png00Prologika - Teo Lachevhttps://prologika.com/wp-content/uploads/2016/01/logo.pngPrologika - Teo Lachev2025-09-05 14:11:422025-09-05 14:14:45Atlanta Microsoft BI Group Meeting on September 8th (End-to-End Azure DevOps for Data Engineering in Microsoft Fabric)
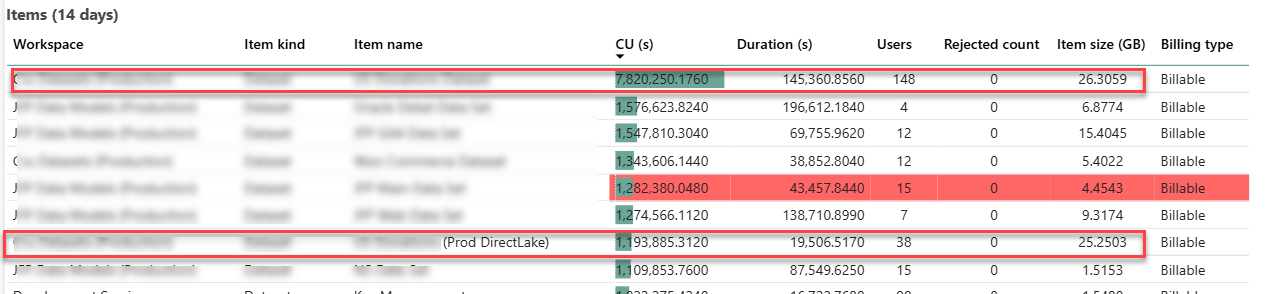
I’ve previously shared my experience with migrating a Fabric imported semantic model to Direct Lake. This blog follows up with additional observations about performance. The following screenshot is taken from the Fabric Capacity Metrics app and it shows the maximum metrics over 14 days. The two enclosed items of interest are the original imported semantic model (the first item on the list) and its DL counterpart (the seventh item on the list).
Memory utilization
As I explained in the first part, the whole reason for taking this epic journey was to solve the out-ot-memory blowouts and constant pressure to climb the Fabric capacity ladder. With 1/5 of the user audience testing the dataset in production environment, that dataset grew to a maximum of 25 GB memory utilization which is in line with the imported model. It could have been interesting to downgrade the capacity, such as to F64, and observe how the DL model would react to memory pressure. However, as shown in the screenshot, the client had other large semantic models that can exhaust the F64 25 memory grant so we couldn’t perform this test.
Again, what we are saving here is the additional memory required for refreshing the model. In a sense, we shifted the model refresh to replicating the data from Google Big Query to a Fabric lakehouse. On the downside, an error during the replication process could leave the replicated tables in an inconsistent state (and user complaints because reports would show no data or stale data) whereas a failure during refreshing the model would fall back on the old model (Fabric builds a new in-memory cache during model refreshing).
The team is currently exploring options to mitigate failures during replications, including incremental replication or using the Delta time-travel features. Replication errors aside, eliminating model refresh is a huge win.
CPU utilization
A while back, I got some feedback that an organization that attempted to switch to Direct Lake found that the capacity CPU utilization increased significantly causing them to revert to import mode.
I didn’t witness CPU pressure during production testing. Further, the team didn’t notice any report performance degradation or increased CU capacity utilization. If I must guess that organization didn’t force the model to Direct Lake Only, causing the model to go back between Direct Lake and Direct Query under certain conditions.
Summary
Assuming you have exhausted traditional methods to alleviate memory pressure, such eliminating high-cardinality column, incremental refresh, etc., Direct Lake is a viable option to conserve memory of Fabric semantic models. Unfortunately, it may require replicating your data to a Fabric lakehouse or migrating your data warehouse to Fabric so that it uses Fabric storage (Delta Parquet format) required for Direct Lake. If this is a new project and you expect large semantic models, your architecture should consider Fabric Data Warehouse or Lakehouse to take advantage of Direct Lake storage for your semantic models.
https://prologika.com/wp-content/uploads/2016/01/logo.png00Prologika - Teo Lachevhttps://prologika.com/wp-content/uploads/2016/01/logo.pngPrologika - Teo Lachev2025-08-24 18:04:052025-08-24 18:04:05Migrating Fabric Import Semantic Models to Direct Lake (Part 2)
“I go checking out the reports, digging up the dirt
You get to meet all sorts in this line of work
And when I find the reason, I still can’t get used to it
And what have you got at the end of the day?
What have you got to take away?”
Private investigations, Dire Straits
Here we go
Me: “Write code to do this and that.”
LLM: “I’m glad to help. Here is the code.”
Me: “It doesn’t work because of this error <nasty error message follows>”
LLM: “You get this error because…Here is the correct code.”
Me: “Doesn’t work again because of this new error <nastier error message follows>.”
LLM: “You get this error because…Here is the correction of the corrected code.”
After N iterations and mutual blame, we either get eventually to working code or give up and start cursing each other. LLM usually quits first, claiming I have exhausted my quota, so I start harassing the next vendor.
Me: “Why didn’t get it right the first time?”
LLM: “That’s rude…I’m learning and I can make mistakes…don’t hurt my feelings.”
Teo’s top 5 LLM professional wishes
These typical exchanges inspired by top 5 LLM wishes:
If you are still learning, why can’t you be more humble and less assertive? This reminds me of some members of my family whose level of assertiveness is a reverse correlation with their knowledge of the subject. But it could be that LLMs are designed to act as humans in this regard too.
When it comes to code generation, can we use the latest versions, class signatures, etc.? We all know how quickly programing interfaces evolve.
Even better, can you compile the code to ensure that at least I don’t get compile errors?
Best, can you actually run the code instead of claiming that the code will produce the desired outcome?
When you substantiate your claims with references, can you ensure that they do what I asked you to do? Can you display a warning that you’re reasoning over some code example that is N years old?
Admiration lives on
Other than that, I keep on being impressed with LLMs. Specifically, I’m impressed by their reasoning and code generation capabilities, especially when it comes to pioneering languages that have decided to plant their flag in lands unknown, such as Power BI DAX, Power Query M, and Azure Data Factory (whatever bizarre expression language it adopted).
As of now, I believe that experts and architects who have solid foundation skills are in position to gain the most as I won’t trust AI to make architectural or design decisions.
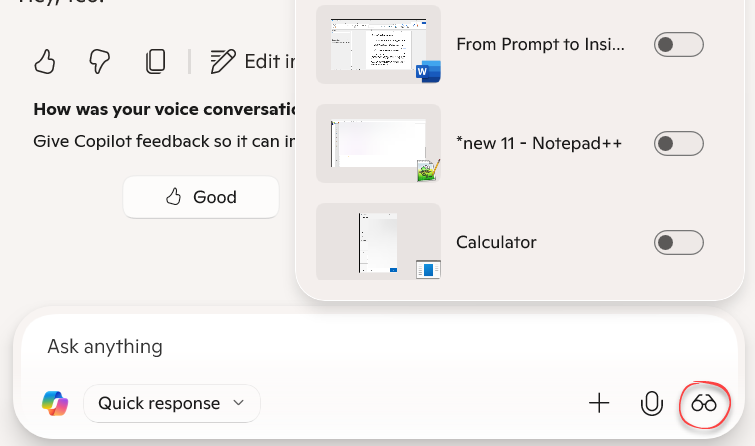
Speaking of being impressed, the latest gem I’ve discovered was Microsoft Copilot Screen Sharing. I used it recently to analyze charts from the Fabric Capacity Metrics app whose primary design goal appears to be leaving the user utterly confused or convinced that it’s time to upgrade their Fabric capacity (see these red spikes? time for upgrade!). In my humble opinion, its output could have been much more useful if it had a chart showing the average resource utilization instead of actual, but I digress. However, the Screen Sharing feature saved taking screenshots and intelligently pointed out what the issue was.
On the downside, ChatGPT did a better job with screenshots. For example, it correctly identified ‘AS’ as Analysis Services workload and came up with better conclusions. Luckily, having multiple assistants it’s not an issue and they don’t complain unless you start abusing them…
https://prologika.com/wp-content/uploads/2016/01/logo.png00Prologika - Teo Lachevhttps://prologika.com/wp-content/uploads/2016/01/logo.pngPrologika - Teo Lachev2025-08-10 14:33:582025-08-10 14:35:33From Prompt to Insight: My Daily Dance with AI
Atlanta BI fans, please join us in person for our next meeting on Monday, August 4th at 18:30 ET, which marks the 15th anniversary of the Atlanta Microsoft BI Group! Lakshmi Ponnurasan (a Microsoft Data Platform MVP and a Certified Power BI specialist) will show us how to apply Power BI time-saving built-in features to create stunning and impactful reports in less time. And your humble correspondent will walk you through some of the latest Power BI and Fabric enhancements. For more details and sign up, visit our group page.
Delivery: In-person Level: Intermediate Food: Pizza and drinks will be provided
Agenda:
18:15-18:30 Registration and networking
18:30-19:00 Organizer and sponsor time (news, Power BI latest, sponsor marketing)
19:00-20:15 Main presentation
20:15-20:30 Q&A
Overview: Power BI is like a treasure chest packed with powerful built-in features- except these gems are often hidden in plain sight, waiting to be discovered. These time-saving built-in features can help you create stunning, impactful reports in less time. In this session, you’ll witness these hacks in action, and by the end, you’ll have at least one new hack up your sleeve to impress your colleagues.
Who Should Attend? This session is perfect for anyone who knows the basics of Power BI or wants to discover its full potential. Just bring in your curiosity and a desire to learn! Session Takeaways:
1. Discover built-in Power BI hacks that you might have missed.
2. Watch real-time demonstrations of how these features can save you time.
3. Learn how to use these features to enhance your reports and increase your overall efficiency.
Walk Away With:
Exercise files, so you can go home, flex those new skills, and start wowing everyone with your Power BI skills!
Speaker: Meet Santhanalakshmi- a Microsoft Data Platform MVP and a Certified Power BI specialist and one of the four finalists of the 2025 Microsoft Power BI DataViz World Championships! Known for turning raw data into eye-catching, actionable insights, she blends creativity with deep technical know-how to build reports that truly stand out. By day, she’s a dynamic Product Lead juggling market research, testing, team collaboration, marketing, and content creation. By passion, she’s a speaker, blogger, and mentor- always eager to share tips, best practices, and encouragement with the data community, especially uplifting women in tech. Outside the data world, she’s a proud Corgi mom, outdoor enthusiast, and foodie on a mission to try it all!.
Sponsor: Teo Lachev (Prologika)
https://prologika.com/wp-content/uploads/2016/01/logo.png00Prologika - Teo Lachevhttps://prologika.com/wp-content/uploads/2016/01/logo.pngPrologika - Teo Lachev2025-07-30 11:21:382025-07-30 11:21:38Atlanta Microsoft BI Group Meeting on August 4th (Power BI Built-in Gems: Time-Saving Features You Should Be Using)
I’ve recently written about strategies for addressing memory pressures with Fabric large semantic models and I mentioned that one of them was switching to Direct Lake. This blog captures my experience of migrating a real-life import semantic model to Direct Lake.
About the project
In this case, the client had a 40 GB semantic model with 250 million rows spread across two fact tables. The semantic model imported data from a Google BigQuery (GBQ) data warehouse. The client applied every trick in the book to optimize the model, but they’ve found themselves forced to upgrade from a Power BI P1 to P2 to P3 capacity.
I’ve written in the past about my frustration with Power BI/Fabric capacity resource limits. While the 25 GB RAM grant of a P1/F64 capacity for each dataset is generous for smaller semantic models, such as for self-service BI, it’s inadequate for large organizational semantic models. Ultimately, the developers must face gut wrenching decisions, such as whether to split the model into smaller semantic models, to obey what are in my opinion artificially low and inflexible memory limits. As a reference, my laptop has more memory than the P1/F64 memory grant and the price for 1 GB server RAM is $10.
So, we’ve decided to replicate the GBQ data to a Fabric lakehouse and try Direct Lake in order to avoid the dataset refresh which requires at least twice the memory. Granted, replicating data is an awkward solution, but currently Direct Lake requires data to be in a Fabric repository (Lakehouse or Data Warehouse) in the same tenant.
I’d like to indulge myself and imagine a future where other columnar database vendors will follow Microsoft and Databricks and embrace Delta storage, instead of proprietary formats, such as in the case of GBQ. This could allow semantic models to map directly to the vendor’s database, thus avoiding replication and facilitating cross-vendor BI architectures.
Replicating data
I used a Fabric Copy Job to replicate about 50 tables (all tables in one job) from GBQ to Fabric Lakehouse. Overall, the team was happy with how easy is to set up Copy Job and its job performance (it took about 40 minutes for full replication). As it stands (currently in preview), I uncovered a few Copy Job shortcomings compared to the ADF Copy activity:
No incremental extraction (currently in preview for other data sources but not for GBQ).
Doesn’t support mixing different options, such as incremental extraction for some tables and full load for others, or Overwrite mode for some tables an append for others. Currently, you must split multiple tables in separate jobs to meet such requirements. In addition, copying multiple tables doesn’t give you the option to use custom SQL statement to extract the data.
Bugs. It looks like every time we make a change to the Source Data, such as changing the name of the destination tables, the explicit column mappings are lost to a point where we had to stop using them.
4. Cannot change the job’s JSON file, such as if you want to quickly make find and replace changes.
5. The user interface is clunky and it’s difficult to work with. For example, you can’t resize or maximize the screen.
Semantic model migration notes
Here are a few notes about the actual migration of the semantic model to Direct Lake that go beyond the officially documented Direct Lake limitations:
Then, I used the Microsoft Semantic Link “Migration to Direct Lake” notebook. The notebook is very easy to use and did a respectable job of switching the table partitions to Direct Lake.
In this project, the client used a Power Query function to translate the column names. Luckily, the client had a mapping table. I used ChatGPT to update the model by asking to look up each column in the mapping table and derive what the sourceColumn mapping should be. Most of time was spent fixing these bindings.
Then, I used the preview feature of Power BI Desktop to create a project connected to the Direct Lake model. Then, I changed the model setting to Direct Lake behavior to avoid falling back on Direct Query.
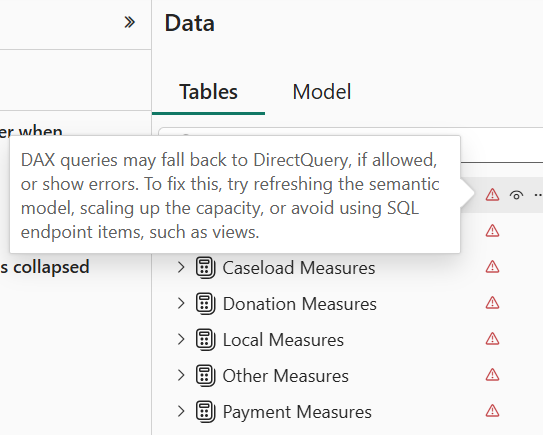
I quickly found that Direct Lake is very picky about metadata. Even if one column mapping is wrong, it invalidates the entire model. This manifests with errors showing for each table when you switch to the Model tab in Power BI Desktop.
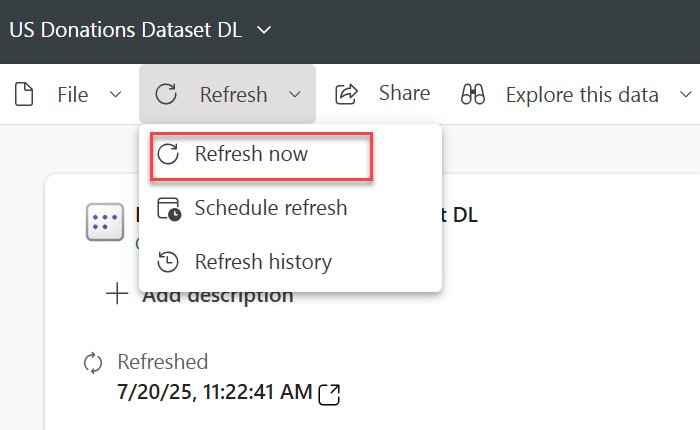
Attempting to refresh the model in Power BI Desktop to figure out what’s wrong produces all sorts of nonsensical errors. Instead, I used the “Refresh now” task in Power BI Service. This shows an error indicator next to the model that you can click to see the error description and you have to tackle each error one at the time by fixing it in the model.bim file in Power BI Desktop. Again, most errors were caused by wrong column mappings.
The Microsoft notebook doesn’t migrate field parameters successfully. I had to look up the extended properties for the main field and add it manually to the model.bim file.
The client had a Date dimension with dates starting with 1/1/1899 in order to support spurious dates from legacy data sources. This caused all measures to produce an error “A DateTime value is outside of the transportation protocol’s supported range. Dates must be between ‘1899-12-30T00:00:00’ and ‘9999-12-31T23:59:59’.” In import mode, Power BI auto-fixes bad dates but in DirectLake you must fix this on your own. So, we nuked 1899 in the date table.
The original model had two date-related tables mapped to the same DW Date table. This is not allowed in Direct Lake so I had to clone the Date table one more time in the lakehouse.
The original model used dummy tables to organize measures. These tables were created as DAX calculated tables which (together with calculated columns) are not allowed in Direct Lake. Instead, I created dummy tables with one column using a Python notebook in the lakehouse.
Using dummy tables to organize measures is a popular technique which I personally avoid for two main reasons. A while back I assessed a semantic model which had thousands of measures assigned to one Measures dummy table. This caused significant report performance degradation. Also, this approach confuses Power BI Q&A (not sure about copilot). I don’t know if Microsoft has resolved these issues, but I personally don’t use dummy tables. Instead, I assign measures to the actual fact tables.
Summary
Other than that, and after a few days of struggle, the model has been successfully blessed by Fabric as a Direct Lake model. Preliminary testing shows that performance is on par with import mode and we are optimistic that this approach will help significantly reduce the model memory footprint and possibly allow the client to downgrade the capacity, but more testing is warranted. And this will probably justify another blog in near future so stay tuned.
https://prologika.com/wp-content/uploads/2016/01/logo.png00Prologika - Teo Lachevhttps://prologika.com/wp-content/uploads/2016/01/logo.pngPrologika - Teo Lachev2025-07-20 12:46:112025-07-20 12:46:11Migrating Fabric Import Semantic Models to Direct Lake
Atlanta BI fans, please join us in person for our next meeting on Monday, July 7nd at 18:30 ET. Shabnam Watson (BI consultant and Microsoft MVP) will introduce you to Microsoft Fabric copilots. And your humble correspondent will walk you through some of the latest Power BI and Fabric enhancements. For more details and sign up, visit our group page.
Delivery: In-person Level: Intermediate Food: Pizza and drinks will be provided
Agenda:
18:15-18:30 Registration and networking
18:30-19:00 Organizer and sponsor time (news, Power BI latest, sponsor marketing)
19:00-20:15 Main presentation
20:15-20:30 Q&A
Overview: Microsoft Fabric is revolutionizing data analytics, and Copilot is here to make it even smarter! Now available across all Fabric capacities, Copilot is more accessible than ever, allowing users at all levels to take advantage of AI-driven efficiencies. This session is a beginner-friendly introduction to Copilot within Microsoft Fabric, showcasing how AI can streamline data workflows, enhance insights, and boost productivity.
We’ll dive into what Copilot in Fabric is and how it fits into different data workflows, helping with things like data engineering, analytics, and reporting. You’ll see real-world examples of how Copilot makes tasks—like writing SQL queries, creating Power BI visuals, and summarizing data—way easier.
By the end of this session, attendees will have a solid foundation in Copilot’s capabilities within Fabric and feel ready to incorporate AI-driven efficiencies into their data workflows.
Speaker: Shabnam is a business intelligence consultant and owner of ABI Cube, a company that specializes in delivering data solutions using the Microsoft Data Platform. She has over 20 years of experience and is recognized as a Microsoft Data Platform MVP for her technical excellence and community involvement.
She is passionate about helping organizations harness the power of data to drive insights and innovation. She has a deep expertise in Microsoft Analysis Services, Power BI, Azure Synapse Analytics, and Microsoft Fabric. She is also a speaker, blogger, and organizer for SQL Saturday Atlanta – BI version, where she shares her knowledge and best practices with the data community.
Sponsor: Shabnam Watson (Abicube)
https://prologika.com/wp-content/uploads/2016/01/logo.png00Prologika - Teo Lachevhttps://prologika.com/wp-content/uploads/2016/01/logo.pngPrologika - Teo Lachev2025-07-01 11:23:122025-07-01 11:23:12Atlanta Microsoft BI Group Meeting on July 7nd (Getting Started with Copilot in Microsoft Fabric)
“Well, I’ll be damned
Here comes your ghost again
But that’s not unusual…”
“Diamonds and Rust”, Joan Baez
I’ve said in the past that I consider it a travesty when a SaaS provider doesn’t give you direct access to the data in its native storage, such as by ODBC and OLE DB providers, and forcing you to use file extracts or APIs (often horrible). This greatly inhibits data integration scenarios, such as extracting data for data warehousing. I wrote on this subject many times, including here, here and here. Let’s look at how two popular vendors have approached data access.
SaaS Loser: Workday
Workday is a popular HR cloud platform. Unfortunately, the only way to get your data out is via their horrible APIs, as a large law firm has discovered. If you use Workday, I recommend you explore the Workday Query Language (WQL) so you don’t have to parse the API results yourself. A third-party (CDATA) driver makes the WQL calls easier but if you don’t want to rely on external software, try the following approach.
Workday’s REST API, particularly the /data endpoint, supports WQL queries directly, allowing custom applications to execute WQL without a third-party tool. The /data endpoint (e.g., https://wd2-impl-services1.workday.com/ccx/api/wql/v1/tenant_name/data) accepts WQL queries, including joins based on Workday’s object relationships. Once you enable WQL, you can use ADF or another data integration tool to send SQL-like queries:
sql
SELECT w.Worker_ID, w.First_Name, o.Name
FROM Workers w
LEFT JOIN Organizations o ON w.Organization_ID = o.ID
WHERE w.Active = 1
Results are returned as JSON which you need to flatten as a dataset. At least, you don’t have to parse the horrible JSON nested payload yourself!
SaaS Winner: NetSuite
NetSuite is a very popular ERP software. I’m currently amid a data integration project with NetSuite. NetSuite has provided two interfaces:
REST (and SOAP) API: This is your best bet if you want to automate writes to NetSuite, such as creating orders and invoices. The REST interface also supports sending SQL queries via the SuiteQL endpoint (https://<account_id>.suitetalk.api.netsuite.com/services/rest/query/v1/suiteql). This is a good option if you want to use SQL for lookups and queries that don’t return a lot of data.
ODBC: Use this option to extract massive datasets, such as when loading a data warehouse. To dump some cold water on NetSuite here, not many integration tools come with native NetSuite providers, so you must resort to the NetSuite ODBC driver (this requires a self-hosted runtime if you use Azure Data Factory). Further, since being an Oracle product, NetSuite probably uses an Oracle backend database, performance is suboptimal, as I have come to expect every time I integrate with Oracle. But a better option for sure than dealing with REST APIs.
https://prologika.com/wp-content/uploads/2016/01/logo.png00Prologika - Teo Lachevhttps://prologika.com/wp-content/uploads/2016/01/logo.pngPrologika - Teo Lachev2025-06-29 13:59:062025-11-19 15:35:51SaaS Losers and Winners: Workday and NetSuite
A current project called for mirroring a Google BigQuery dataset to Fabric. This feature is currently in private preview so don’t try to find it. However, the tips I share here should be applicable to other available mirroring scenarios, such as mirroring from Azure SQL Database.
One of the GBQ tables was a transaction fact table with some 130 million rows. The issue was that the mirroring window would show this table as normally replicating table with Running green status, but we waited and waited and nothing was happening…
First, the “Rows Replicated” counter is not continuously updating (doesn’t report live mirroring info). Instead, it’s updated when the table is fully replicated. That’s because the Delta table operations are atomic in nature.
So, how do we do live monitoring of the initial synchronization then? We can use the Azure Storage Explorer to access directly the delta files of the mirrored database as described here. After some experimenting (shorten the URL below to the workspace name only to see all OneLake artifacts in the workspace), I’ve found that the itemType of a mirrored database is MountedRelationalDatabase. So, the URL to an Adventure Works mirrored database in a workspace named Fabric Tutorial would be https://onelake.dfs.fabric.microsoft.com/Fabric Tutorial/Adventure Works.MountedRelationalDatabase/
This lets us get to the underlying delta tables and delta logs in Azure Storage Explorer which are of course updating as data is being replicated. Examining the underlying storage is also useful to detect potential issues. Here is an example of the first table that was successfully replicated. Note that there is a parquet file containing the actual data.
And here is an example of the second table. As we can see, the delta log was created but there is no parquet file. So, something went wrong although according to Fabric all is well.
To summarize, the Fabric mirroring UI has left a lot of room for improvement. By examining the delta log file size and delta files of a specific table we can discover how the mirroring session of the initial synchronization is progressing.