None of the Multidimensional and Tabular semantic models I've implemented required scaling out, but I understand that some scenarios might benefit from it, such as B2B or B2C reporting. Depends on the implementation approach, another benefit could be implementing a highly available farm. Implementing a scaled-out, on-premises SSAS farm is not easy. There are different techniques but all of them involve a compromise between availability…
Object-level security (OLS) is a frequently requested security feature when implementing semantic models. For example, a current project disallows some sales persons to see sensitive measures, such as Margin and Profit. In Multidimensional, modelers could use cell security to meet such requirements with the risk of compromising performance. Starting with SQL Server 2017 (compatibility level 1200), Tabular supports object-level security to disallow access to entire…
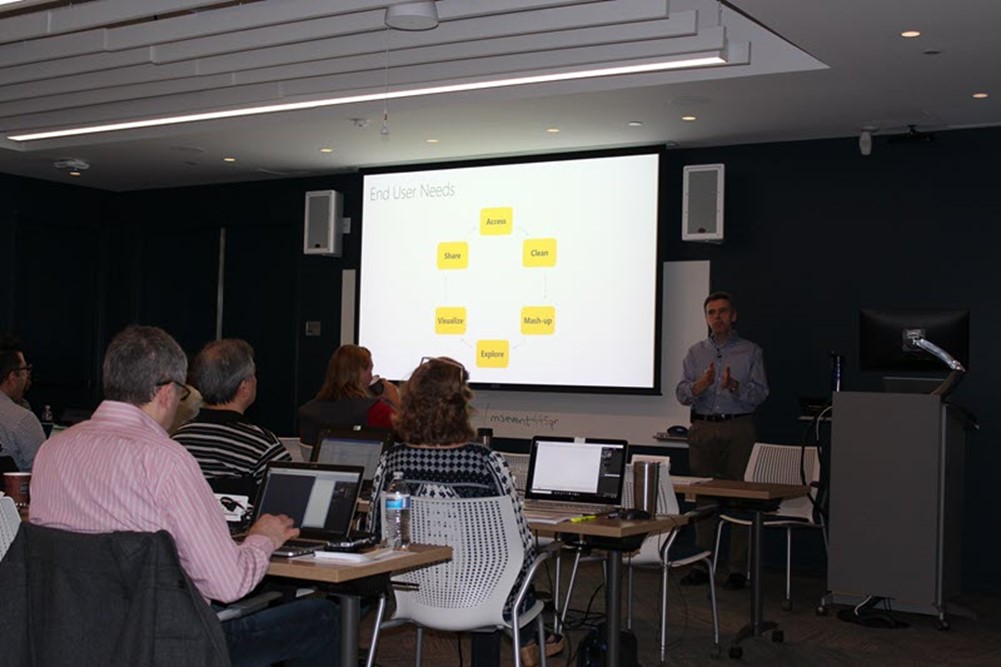
Thank you to everyone attending the Power BI workshop by Prologika yesterday. We had great turnout with more than 50 people from 30 companies attending the event at the Microsoft Technology Center in Alpharetta! The key takeaways were: Many companies transition to Power BI because of its great value-to-cost proposition. PowerQuery is a fantastic tool for data cleansing and transformation that is missing in other…
In my "Notes on Analysis Services Performance and Parallelism" blog, I shared limited performance results about scaling up Azure Analysis Services Tabular. As I mentioned, I expect the same findings to apply to SQL Server Analysis Services Tabular for on-premises deployments. As the official load test results came in, I'm ready to provide more info and general recommendations. We load tested the AAS semantic model mentioned in…
As a part of a semantic model assessment, I got to experiment with different configurations of Azure Analysis Services. In this case, the largest fact table has almost 2 billion rows so it's a good size model. I was particularly interested the correlation between a higher performance tier and query performance. One thing that I like about PaaS is that it's easy to change and…
Chris Webb wrote a great post today "Power BI Roadmap Announcements In the Dynamics 365 Spring '18 Release Notes" citing the many exciting new features coming to Power BI in the next few months and highlighting the huge momentum behind Power BI. I want to bring your attention to a couple of them: Incremental data refresh: Organizations can use incremental data refresh to scale datasets…
MS BI fans, join us for the next Atlanta MS BI and Power BI Group meeting on Monday, March 26th at 6:30 PM. Leo Furlong will introduce you to implementing organizational semantic models with Azure Analysis Services. BlueGranite will sponsor the meeting. And your humble correspondent will demo several latest Power BI features: persistent filters, tooltip pages, and share to anyone. For more details, visit our group page and don't forget…
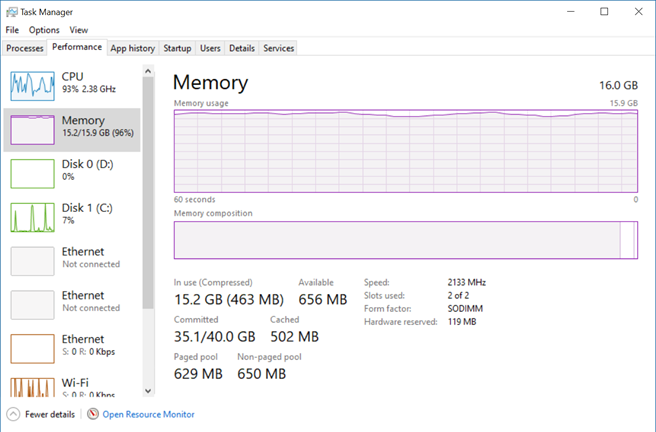
I'm doing an assessment of a data mart and semantic layer for an organizational BI solution. I was given the source of the Analysis Services Tabular model. Upon opening it locally, it took Visual Studio several minutes to open the project. Even worse, after the project was finally loaded, my laptop CPU utilization went into 80-90% and all the 16 GB of memory got exhausted…
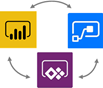
Extending Power BI with PowerApps and Flow With hundreds of vendors out there, choosing a BI tool isn't easy. If you've been following me for a while, you know that I love Power BI. One of the Power BI most prominent strengths is that it's a part of the much broader Microsoft Data Platform that spans various on-premises and cloud offerings for data storage, processing,…
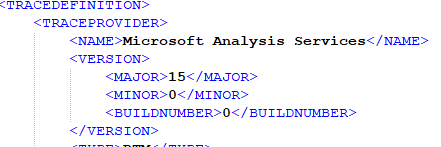
Scenario: You use Azure Analysis Services and you want to trace events in the SQL Server Profiler. However, you run the Profiler, connect to AAS, and you get greeted with "Unable to locate trace definition file Microsoft Analysis Services TraceDefinition 15.0.0.xml". The prompt gives you an option to download the trace definition from the server, but nothing happens. You'll encounter the same issue if you…