Demystifying Clustered Columnstore Indexes

Non-clustered columnstore indexes (NCCI) were introduced in SQL Server 2012 to improve the performance of large aggregate queries (common for data warehousing) with the caveat that there were read-only. Consequently, the ETL process has to drop NCCI, load the data, and recreate the columnstore index.

NOTE Building an index (columnstore or regular) should be a highly-parallel operation. Building a columnstore index in particular should max out all licensed cores. Currently, we have an open support case with Microsoft where a columnstore index allows adding a computed column (while it shouldn’t). Consequently, SQL Server builds the index using a single thread which may lead to excessive index creation times.

SQL Server 2014 introduced clustered columnstore indexes (CCI) which offer two main advantages:

  1. CCI is updatable — Therefore, you don’t have to drop and recreate the index anymore.
  2. Storage is greatly reduced — For example, you might have a fact table of 100 GB. Assuming x10 compression, your table space with NCCI will be 110 GB. However, if you create CCI the table space will be only 10 GB. This is why Analytics Platform System (previously known is PDW) uses CCI.

On the downside, CCI doesn’t support any other indexes that you might need to optimize ETL or speed up joins. Basically, CCI is the only index you can have on a table. However, CCI is not designed for equality and short-range queries that are typical for detail-level SELECT or MERGE queries. It’s a common misconception that you don’t need such indexes with CCI but this is not the case. I hope a future release of SQL Server enhances CCI to support regular indexes as well.

Presenting at Atlanta.MDF

I’m presenting at the Atlanta.MDF group on Monday, January 12th. I’ll be covering a wide range of tips and techniques for analyzing and improving performance of SQL Server-based data analytics solutions. Hope you can make it.

Title: Can Your Data Analytics Solution Scale?

Abstract: Does your ETL exceed its processing window? Do your users complain about the SSRS spinny? Can your SQL Server database design deliver the expected performance? Can the system scale to thousands of users? Join this session to learn best practices and tips for isolating bottlenecks and improving the performance of data analytics solutions. I’ll dissect the layers of a “classic” solution (relational database, ETL, data model, reports) and share solutions harvested from real-life projects to address common performance-related issues. 

SQL Server and 20 Cores Limit

Scenario: You execute a SQL Server 2012 task that uses parallelism, such as index rebuild or a query on a server with more than 20 cores running SQL Server 2012 Enterprise Edition. In the Windows Task Manager, you observe that the task uses only 20 cores. We discovered this scenario during a rebuild of a columnstore index. To confirm this further, you examine the SQL Server log and notice that a similar message is logged when the SQL Server instance starts:

“SQL Server detected 8 sockets with 4 cores per socket and 4 logical processors per socket, 32 total logical processors; using 20 logical processors based on SQL Server licensing. This is an informational message; no user action is required.”

Explanation: More than likely, you have upgraded to SQL Server 2012 from SQL Server 2008 R2 under Software Assurance. Microsoft created a special SKU of Enterprise Edition to support this scenario with the caveat that this SKU limits an instance to using only 20 processor cores (or 40 CPU threads if hyperthreading is enabled). If this level of parallelism is not enough, the only solution is to switch to the Enterprise Edition SKU that is licensed per core and purchase a license that covers as many cores as needed. Once you obtain the new license key, you can upgrade your SQL Server instance:

Setup.exe /q /ACTION=editionupgrade /INSTANCENAME=MSSQLSERVER /PID=<PID key for new edition>” /IACCEPTSQLSERVERLICENSETERMS

Tabular M2M Relationships on the Horizon

One of the biggest strengths of Microsoft self-service BI is the ability to create sophisticated data models on a par with organizational BI models built by professionals. This fact is often overlooked when organizations evaluate self-service tools and the decision is often made based on other factors but not insightful understanding of the data model capabilities. This is unfortunate because most popular tools on the market don’t go much further than supporting a single dataset. By contrast, Power Pivot allows you to import easily multiple datasets from virtually anywhere and join the resulting tables as you can do in Microsoft Access. This brings tremendous flexibility and analytical power.

Unlike multidimensional cubes, one of the limitations of the Power Pivot and Tabular data models has been the lack of support for declarative many-to-many relationships. The workaround has been using a simple DAX formula to resolve the relationship over a bridge table, such as =CALCULATE (SUM (Table[Column] ), <BridgeTable>) but this approach might present maintenance issues, as you have to create multiple calculated measures to support different slicing and dicing needs. However, as pointed out in my latest newsletter, the upcoming version of Power BI aims to remove adoption barriers and adds new features. And, one of this features, is bidirectional relationships and declarative support of M2M relationship, which Chris Webb already wrote about.

To test the M2M relationship, I attempted to create the same M2M scenario that I used in my book, which models a joint bank account. The corresponding Power Pivot schema is shown below. The CustomerAccount table is the bridge table that resolves the M2M relationship (a customer might have many accounts and a bank account might be shared by multiple customers). The Balances table stores the account balances over time and the Date table lets us analyze these balances over time.

010415_1902_TabularM2MR1

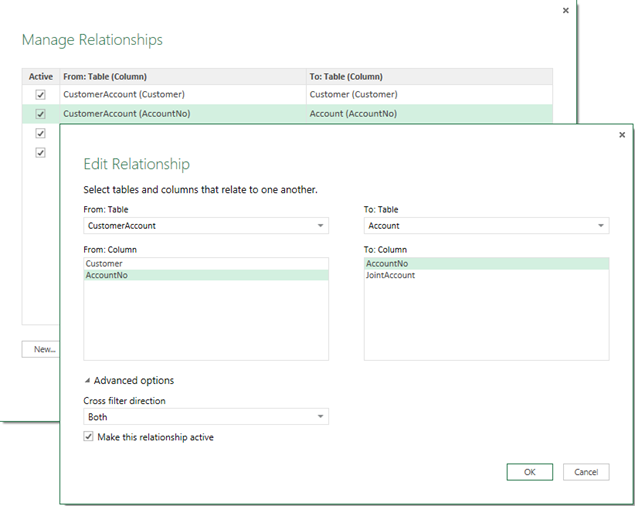
Setting up a M2M relationship in the Power BI Designer is achieved by changing the “Cross filter direction” relationship setting to Both. This setting and bi-directional relationships are described in more details here.

010415_1902_TabularM2MR2

Indeed, creating a report that shows balances by customer resolves the M2M relationship and aggregates correctly.

010415_1902_TabularM2MR3

Unfortunately, attempting to slice the report by Date returns an error in the preview version of the Power BI Designer so the M2M feature is still a work in progress. Brining this further, a useful addition could be declarative semi-additive functions to allow the user to set the aggregation behavior of the Balance measure, such as to LastNonEmpty. Similar to Multidimensional, this will avoid the need for user-defined explicit measures.

Getting ETL Task Duration

Happy New Year!

ETL exceeds the processing time window? Optimizing ETL, starts with obtaining task-level execution times? If you use SSIS 2012 project deployment mode, task-level stats are already loaded in the SSIS catalog and you can use the following query:

SELECT execution_id,

CASE WHEN [status] = 1 THEN ‘created’

WHEN [status] = 2 THEN ‘running’

WHEN [status] = 3 THEN ‘canceled’

WHEN [status] = 4 THEN ‘failed’

WHEN [status] = 5 THEN ‘pending’

WHEN [status] = 6 THEN ‘ended unexpectedly’

WHEN [status] = 7 THEN ‘succeeded’

WHEN [status] = 8 THEN ‘stopping’

WHEN [status] = 9 THEN ‘completed’

END AS [status_text],

DATEDIFF(ss,start_time,end_time) DurationInSeconds

FROM catalog.executions e

What if you are not on SSIS 2012 or later yet or you are not using the project deployment mode or a framework that logs the task duration? You can still obtain the task duration but you need to enable SSIS logging for each package you want to monitor, as follows:

  1. Open the package in BIDS/SSDT.
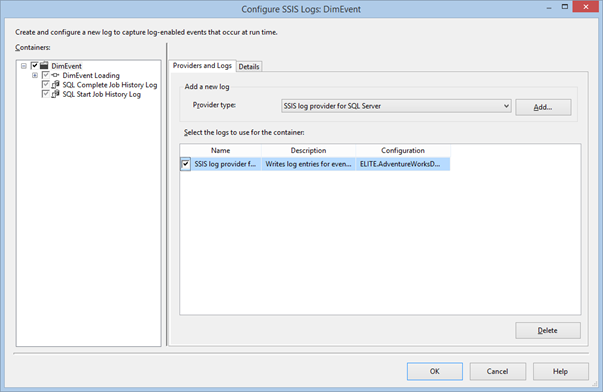
  2. On the SSIS menu, click Logging. Configure logging to use the SSIS Log Provider for SQL Server. The provider will save the statistics in a SQL Server table so you can easily query the results.010215_2129_GettingETLT1
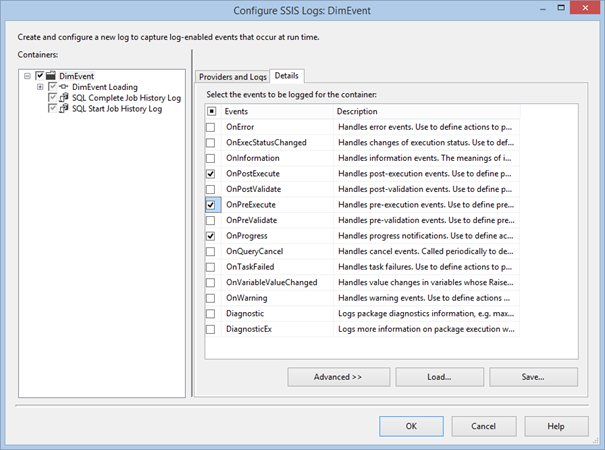
  3. On the Details tab, select the OnPreExecute, OnPostExecute, and most importantly the OnProgress event so you can get the same level of execution statistics as in the BIDS/SSDT Progress tab.010215_2129_GettingETLT2
  4. Once you configure the SSIS Log Provider for SQL Server, it will create a sysssislog table in the database you specified when you configured the provider. When the SQL Server Agent executes your package, you can use a query like the one below to obtain task-level durations:

    SELECT executionid Execution,

    PackageName = ( SELECT TOP 1 source FROM dbo.sysssislog S WHERE S.executionid = L.executionid AND S.[event] = ‘PackageStart’ ),

    PackageStep = l.source,

         Runtime_min = DateDiff(minute, MIN(L.starttime), MAX(L.endtime)),

    Runtime_hr = DateDiff(hour, MIN(L.starttime), MAX(L.endtime)),

    StartTime = MIN(L.starttime),

    EndTime = MAX(L.endtime),

    FinishDate = CAST(MAX(L.endtime)AS DATE)

    FROM dbo.sysssislog L WHERE L.[event] != ‘PackageStart’
    GROUP BY executionid, L.source

2015 Annual TI Forecast by TEKsystems

TEKSystems has been a wonderful sponsor of the Atlanta MS BI Group. They’ve recently published an interesting 2015 Annual TI Forecast report. According to the report, Business Intelligence/Big Data will be among the top most impactful technologies in 2015. More key facts:

  • Seventy-one percent of IT leaders report confidence in their ability to satisfy business demands in 2015, representing an increase from 66 percent and 54 percent in forecasts for 2014 and 2013, respectively.
  • The top five areas where most IT leaders expect to increase spending in 2015 include security (65 percent), mobility (54 percent), cloud (53 percent), BI/Big Data (49 percent) and storage (46 percent). Twenty-nine percent of IT leaders also expect to increase spending on ERP.
  • Seventy-three percent of IT leaders indicate that operational objectives such as reducing costs, improving efficiency, consolidating, standardizing and streamlining present the biggest organizational challenges.
  • Salary increases are most likely to be average, with 68 percent of IT leaders saying that they expect overall staff salaries to increase by up to 5 percent. Only 8 percent expect increases of 6 percent or more and 21 percent expect salaries to remain the same.
  • Hiring expectations have also slowed. Entering 2014, 47 percent of IT leaders expected an increase in full-time IT staff hiring. Entering 2015, just 40 percent expect an increase, and 50 percent expect it to be the same as 2014.

Atlanta MS BI Group Meeting Tonight

Come and join us tonight for last 2014 meeting of the Atlanta MS BI Group. In the spirit of the season, I’ll revisit its most important tools and their role in a holistic and modern data analytics environment. Then, for each tool, I’ll discuss its indented use, as well as its pros and cons. We’ll discuss self-service and organizational BI, on-premise and cloud, emerging technologies, and how they complement each other in the context of Microsoft BI. And, Mark Tabladillo will do us a cool demo of the Azure Machine Learning Web Service. $60 Pizza Hut gift card and other cool door prices from Aspen Brands will be given away. Kudos to our fantastic sponsor TEKSystems for buying us food and drinks!

Embedded Power View and Pivot Reports

I’ve been pestering Microsoft for years to provide an embedded Analysis Services Viewer control (similar to the SSRS ReportViewer) that would allow developers to embed interactive reports on custom Windows Forms and web applications. And, for years nothing happened, even after Microsoft acquired the Dundas OLAP Chart control in 2008. There are some positive signs on that end lately. Microsoft just rolled out the ability to embed Power View and pivot reports on a webpage or blog. I’m sure there are some scenarios that will be benefit from this feature but this is really not what I want because:

  1. It’s just an URL-based mechanism targeting deployed reports and its customization options are limited to layout adjustments.
  2. It’s not a control that developers can customize, such as to change the connection string in order to pass custom user credentials, replace parameters, etc.
  3. It requires the reports to be hosted in Office 365. Hence, at least for now, this feature can’t be used with on-prem data.

SQL PASS Summit 2014 Links

Don’t miss the gist of SQL Pass Summit 2014.

Keynote Day One: http://www.sqlpass.org/summit/2014/PASStv.aspx?watch=7Pum0vfYtSk

Keynote Day Two: http://www.sqlpass.org/summit/2014/PASStv.aspx?watch=g8DSwPjmLv4

All PASStv sessions can be found here: http://www.sqlpass.org/summit/2014/PASStv.aspx

Presenting at Dama-Georgia and Atlanta BI Group

I’ll present at DAMA Georgia Chapter on November 12. The topic will be “Best Practices for Establishing a Solid BI Foundation”. For more details, please visit the event page.

Don’t know where to start with BI or if you’re on the right track? Just like everything else, a successful BI rollout is based on a solid foundation. Targeting BI managers, technology officers, and architects, this advisory and technical session presents proven best practices to implementing BI for mid-size and large organizations. I’ll present approaches and recommendations for the main layers of the BI architectural stack, ranging from staging databases, data marts and warehouses, semantic layers, and reporting tools. We’ll discuss self-service and organizational BI, Big Data, and emerging technologies, and how they complement each other. Some of the concepts will be accompanied by demos using the Microsoft BI stack.

Then, on December 15th, I’ll present “Microsoft BI 2014 Review” at the Atlanta BI Group.

In the spirit of the season, join us to reflect on the state of Microsoft BI Platform at the end of year 2014. I’ll revisit its most important tools and their role in a holistic and modern data analytics environment. Then, for each tool, I’ll discuss its indented use, as well as pros and cons. We’ll discuss self-service and organizational BI, on-premise and cloud, emerging technologies, and how they complement each other in the context of Microsoft BI.

If you are in Atlanta, I hope you can join me to talk data analytics.