Teo’s Best and Worst of Microsoft BI in 2013

In the spirit of the last day of 2013, I’m sipping eggnog and contemplating on BI in 2013.

BEST

  1. Microsoft leads the Gartner’s 2013 Business Intelligence Magic Quadrant.
  2. Microsoft leads the Gartner’s 2013 Data Warehouse Magic Quadrant.
  3. Power View connectivity to Multidimensional (DAXMD) released in CU4 of SQL Server 2012 SP1.
  4. SQL Server 2012 Parallel Data Warehouse appliance released with Hadoop support at very attractive pricing.
  5. Microsoft is the first vendor to offer natural queries (unfortunately only in the cloud at this point).

WORST

  1. Microsoft not doing enough to compete effectively on the presentation/visualization front against third party vendors. I’ll throw poor mobile support into this bucket too.
  2. Slow pace of BI enhancements across product groups. Example: Excel’s still lacking Power View support for Multidimensional (DAXMD was released in May).
  3. Microsoft pushing cloud BI and deciding to prioritize cloud enhancements, such as natural query, over on premises.
  4. Microsoft’s ongoing preoccupation with Tabular (it’s difficult to find a good case for it as it’s caught now in the middle between columnstore indexes and Multidimensional) and self-service BI (focus should be 80% on organizational BI and 20% on personal).
  5. Still no metadata lineage and change impact. What happened to Project Barcelona?

Happy New Year!

SharePoint 2010 and Excel 2013 Power Pivot

I’ve start seeing customers moving to or considering Office 2013 for self-service BI. Naturally, the end users would like to share their Excel 2013 self-service data models by deploying to SharePoint. Does SharePoint 2010 support this scenario? Unfortunately not. The user can upload Excel 2013 files and view the embedded reports. However, when he attempts to perform an interactive action (triggers all backend services involved in processing Power Pivot workbooks) he gets the dreaded error “Unable to refresh data for a data connection in the workbook”. What’s wrong in this case is that due to the Excel 2013 changes to support Power Pivot natively, Excel Services must load the data model in a different way. This is discussed in more details in the “‘Unable to refresh data for a data connection in the workbook’ error when you interact with an Excel 2013 workbook in a SharePoint Server 2010 farm” article by Microsoft. Note that the only resolution path is to upgrade to Share Point 2013.

Again, the issue is with Excel Services and not with the Power Pivot version. If the user has Excel 2010 with the latest Power Pivot bits (SQL Server 2012 SP1 version of Power Pivot), then the SharePoint 2010 integration works. To make the upgrade story short:

  1. Match SharePoint version with the Office edition. If you need to support Excel 2013 Power Pivot workbooks, upgrade to SharePoint 2013.
  2. The SQL Server instance behind Power Pivot for SharePoint must match the Power Pivot version on the client. For example, if the users have Excel 2010 with the SQL Server 2012 SP1 version of Power Pivot, the SQL Server instance installed on the SharePoint server should be SQL Server 2012 SP1. SQL Server 2008 R2 won’t be able to handle the latest Power Pivot bits.

This is definitely something to watch and plan for when considering upgrading to Office 2013.

Presenting Visualization Options in Microsoft BI

If you have some time amidst the holiday rush, join me on Monday, December 9th, at the Atlanta BI meeting, where I’ll present Visualization Options in Microsoft BI.

“Confused about visualization choices for your BI solution? How should you design a dashboard to impress your management? Don’t know what presentation options exist for organizational and self-service BI? Join us to find answers to these questions and share best practices about the visualization tools in the Microsoft BI platform.”

Our sponsor will be Computer Associates and you’ll learn about the latest Erwin release.

Also, don’t forget about the user group community party on December 16th.

Microsoft Certified Solutions Expert

Just got myself upgraded from MCTIP BI (which retires on January 31st, 2014) to the new MCSE BI certification by passing the three required exams. Over the course of almost 20 years, I’ve managed to stay current and accumulate a healthy dose of certifications (some of them retired by now), including:

1996: Microsoft Certified Professional

1996: Microsoft Certified Solution Developer

2002: Microsoft Certified Application Developer

2003: Microsoft Certified Trainer

2006: Microsoft Certified Technology Specialist

2011: Microsoft Certified IT Professional

2013: Microsoft Certified Solutions Associate

2013: Microsoft Certified Solutions Expert

Some people doubt the benefits of certifications. True, having a certification might not be a true testament of skills or expertise just like someone who only reads or writes books is not a true practitioner. But as with anything in life, I believe that the more you put in, the more you get out. While it’s hard to measure the intangible benefits of certifications, articles, books, presentations, etc., I do believe that they contribute to the overall package and credibility. Despite the Microsoft Architect and Maestro sagas, I do think that a certification is an important differentiator (especially for consultants and fresh graduates) and something that makes you stand above the crowd. In my consulting career, sometimes I do come across RFPs that require or desire certifications and I like the fact that these customers acknowledge the certification effort. In addition, I like the fact that certifications keep me on the edge by forcing me to study and refresh my memory of product areas that I’ve forgotten or never used. Certifications are also required for achieving Microsoft partner competencies – another very important differentiating factor for consulting companies.

On the downside, while Microsoft has made a great effort to make the exams more engaging and practical (case studies, hot spots, drag and drop, etc.), you still have to adjust to the Microsoft exam mentality. This is how we want to you answer the question despite that it’s not quite clear what we are asking here or it doesn’t make a perfect sense to you. Syntax and step memorizing is another area of improvement. So are all these questions about obscure and unpopular techniques, such as SSAS remote partitions and linked objects. It will be great if the exams are actually written by practitioners as opposed to someone who probably scans Books Online to come up with elusive questions.

Meanwhile, here is my latest logo addition:


111313_2305_MicrosoftCe1


Finalist for BI and Analytics Innovation Awards

Out of 26 applications, our BI solution for Recall Corporation was nominated as one of the six finalists for the BI and Analytics Innovation Awards presented tonight by the Atlanta TAG B/I society! Although we didn’t win the award, we’re honored to be shortlisted. Eric Falthzik, Co-chairman at Technology Association of Georgia – Business Intelligence and Analytics Society and Director of Customer Intelligence at Cox Communications said that this is most interesting and sophisticated Microsoft-based solution that he’s seen.

I’d like to thank Recall for giving us the opportunity to implement an innovative BI solution that changes the way they analyze their business. I’d like to also thank the TAG B/I panelists for appreciating its value.

111313_0341_Finalistfor1
111313_0341_Finalistfor2

Passing Large Report Parameters

Scenario: A custom application needs to display a filter dialog to prompt the user to select accounts from a tree consisting of thousands of nodes, such as a tree that organizes the accounts in levels. Once the user makes the selection, the application passes the account list to a report parameter so that the report can show the data for the selected accounts only.

Issue: The filter list could get rather large. Even if the application follows the Excel filtering pattern to include only the parent node if no child nodes are selected, you might end up with a list consisting of hundreds, perhaps even thousands of accounts. However, Reporting Services has limits on the parameter size. When you test the report in the Report Designer, the report parameter is limited to some 32,000 characters. The Report Viewer doesn’t have this limitation so a string-type report parameter can deceptively take the entire list. However, a change was made in SQL 2012 to limit the parameter size during report rendering. Specifically, ParameterInfoCollection.ToUrl throws an exception “The value of parameter ‘param’ is not valid.” when a parameter value exceeds 65,520 characters. That’s because this method calls the .NET System.Uri.EscapeDataString method which has the 65,520 limit. Interestingly, the report query is executed but the error is thrown after the dataset is processed.

Resolution: What if you still need to pass a parameter value whose size exceeds 65,520 characters? Here are some options:

  1. Although not a solution, the easiest approach is prevention, such as to limit the user selection to 65,520 characters.
  2. Another option is to save the report value to a database and pass the table key to the report parameter. Then, the report query can join to the report parameter table. This approach may work well for relational reports but it doesn’t work so well with cube reports because you can’t join the cube to a relational table. You might try to default the report parameter to a database query that brings the report value from the database but you will still get the above error. For cube reports, one option might be to concatenate the report query text with the filter from the database. Another option could be to write an SSAS stored procedure that retrieves the filter from the database and generates an MDX set.
  3. Yet another option is to compress the report parameter. For example, MDX has a rather verbose notation. Instead of passing the member unique name, e.g. [Account].[Account Level 1].&[1000], consider collapsing the level name to |al1|.&[1000] and then expanding it on the report side by replacing the token with the attribute or level unique name. This approach may reduce the parameter list x10 and help you overcome the 65K limit.

Optimizing Dimension Data Security

Dimension data security is a great feature of Analysis Services and one of the top reasons to strongly consider a semantic layer in your BI implementations, as I mentioned in my “Why Semantic Layer” newsletter. That’s because the server automatically secures the cube at connect time so you don’t have to implement your own security framework and secure every report query. If you are new to dimension data security, I covered it in various places including this article that I wrote for SQL Magazine a while back. One thing to be aware of is that the server applies dimension data security when the user sends the first query after the connection is established even if this query doesn’t specifically request the secured dimension, e.g. SELECT NULL ON 0 FROM [CubeName]. Many things happen at this point (see the steps after “Dimension security is applied to all attributes” in this Mosha blog). This initialization sequence is the price you need to pay to have your entire cube secured. The initialization duration depends on many factors, including the size of the dimension, the size of the allowed set, and the cube script. However, you have some control over the initial performance hit or at least to offset it.

Let’s consider a real-life scenario. A customer has a medium-size cube (about 50 GB) and dimension data security needs to be applied to an Account dimension whose dimension key attribute had about four million members. Specifically, the allowed set had to be applied on an attribute that had about 300,000 members. In this case, the security policies are stored in a factless fact table (for more information how dimension data security works with a factless fact table, see the second part of the above article). The initial initialization time for an allowed set of only two accounts was 9 seconds which is not so bad. However, if the allowed set return 20,000 allowed accounts, the user had to wait for 30 seconds to connect which can surely lead to user complaints.

Reducing the Autoexists Performance Hit

When the server applied dimension data security, it applies it to all attributes within the secured dimension. This behavior is known as Autoexists. In this case, the Account dimension had about 30 attributes. Although dimension security is applied on a single attribute (Level 3), the server automatically secures the rest of the attributes to allow only the members that exist with the allowed members of the secured attribute (if the allowed set returns ‘USA’, Autoexists allows only cities within USA). One way to determine how much time the server spends applying Autoexists is to enable and monitor in the Query Dimension event in the Profiler. Another way would be to remove all the cube script (except the first CALCULATE statement) and track the query execution time before and after.

As I said, the larger the allowed set and the dimension size, the more time will be spent in propagating security to the attributes in the secured dimension. To reduce this time, consider introducing a new dimension, e.g. Account Filter, that has as fewer attributes as possible. Ideally, it should include only the secured attribute although you might need to include the dimension key attribute so you don’t have to make changes to the fact tables in order to join them to the dimension at a higher level. In our case, we tested three scenarios:

Scenario 1: Security applied on the original dimension

An allowed set of two members took 1.7 seconds in Autoexists. An allowed set 20,000 members took 13 seconds in Autoexists.

Scenario 2: Security applied on a new Account Filter dimension that had three attributes (dimension key, secured attribute, and another attribute required to meet the business requirements for security).

An allowed set of two members took 1.5 seconds in Autoexists. An allowed set 20,000 members took 3.5 seconds in Autoexists.

Scenario 3: Security applied on a new Account Filter dimension that had two attributes (secured attribute and another attribute required to meet the business requirements for security). This scenario required changes to the fact tables to bring in the secured attribute in order to join them to the Account Filter dimension.

An allowed set of two members took 1.2 seconds in Autoexists. An allowed set 20,000 members took 1.7 seconds in Autoexists.

Optimizing the Cube Script

This cube had about 3,000 lines, most of them basic calculated members (a best practice is to have calculations defined in the semantic layer instead of reports or elsewhere). The items to pay attention to in the script are static sets and default members (default members can be defined in the dimension itself or in the script). A static set is evaluated once per the user session. With regards to dimension data security, we’ve found that the server evaluates the static set in the context of the allowed members. If you turn the Execute MDX Script Current event to see how much time the server spends evaluating each line in the script. In our case, I’ve found that the following static set took some 10 seconds to evaluate with an allowed set of 20,000 members:

CREATE SET [MonthsWithInventory] AS Exists([Date].[Fiscal by Month].[Month].Members, , “Inventory”); 

When I converted the set to dynamic (CREATE DYNAMIC SET), the overhead disappeared from the initialization time. However, be aware that during the static set evaluation the server warms the cache with the results of the static set. So switching to a dynamic set really saves you the cost of evaluating the Exists query which in this case was expensive. Consequently, the first query will execute faster. But it obviously means that the cache that would have been built up as part of evaluating that set is now not available for other operations. Therefore, subsequent queries that requests data by month might be slower.

What I’ve found also is that overwriting the default members contributes to the initialization times. If you have an option, remove explicit attribute defaults. Interestingly, trying to conditionally bypass the defaults didn’t eliminate the overhead, such as using the following approach:

ALTER CUBE CURRENTCUBE UPDATE DIMENSION [Account].[Active Flag], Default_Member = iif(IsEmpty(CustomData()), [Account].[Active Flag].&[Active], [Account].[Active Flag].DefaultMember);


Special thanks to Akshai Mirchandani on the SSAS team for shedding light in dark places.

The SharePoint 2013 Data Model

Somehow, this PowerPivot for SharePoint gem escaped my attention but it’s a very important deployment enhancement that was more than likely initiated by Power BI and the cloud. Starting with SQL Server 2012 Service Pack 1 and SharePoint 2013, you can set up a dedicated SSAS server in SharePoint mode outside the SharePoint farm and configure the farm to point to it. This was possible as a result of all the integration work done between Excel Calculation Services, SharePoint and AS for the 2013 release. Previously, the SSAS in SharePoint configuration mode instance had to be installed on the SharePoint application server.

This brings more flexibility to scaling out your PowerPivot environment outside SharePoint and simplifies the PowerPivot setup. For example, to scale out Analysis Services, you can simply add a new SSAS server configured in SharePoint mode. Excel Calculation Services will balance the load between all available SSAS servers automatically based on health statistics obtained from these server instances. Same thing if you want to make the backend fault-tolerant. If one server goes down, the workbooks that used to be on the failed server will automatically get redeployed on the others by Excel Calculation Services. Specifically, the next time the workbook is accessed by a user, ECS would realize that the workbook is no longer on any active node and the workbook would get loaded once again on a different node.

To register a new server in SharePoint 2013:

  1. Open the SharePoint Central Administration, in the Application Management section, click Manage service applications.
  2. On the Manage Service Applications page, click the Excel Services service application that you want to manage.
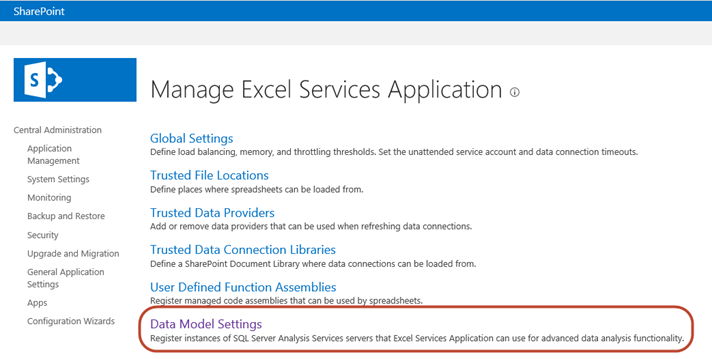
  3. On the Manage Excel Services page, click Data Model.

102713_0124_TheSharePoi1

Then, in the Excel Services Application Data Model Settings, click Add Server to register the new server.

102713_0124_TheSharePoi2

The PowerPivot setup is simplified as well because you don’t need to install the PowerPivot for SharePoint add-in, as explained here. However, the add-in is still required for the PowerPivot for SharePoint full capabilities, including PowerPivot Gallery, scheduled data refresh, and the PowerPivot management dashboard. Finally, having a dedicated SSAS server might save you money if you need to scale out. That’s because you no longer need to license SSAS on each SharePoint application server assuming you don’t need the other SQL Server components, such as SSRS. Further savings can be realized by deploying SSAS in SharePoint as another instance to an existing SSAS server (Multidimensional or Tabular) you have. To my understanding, the same version instances are covered by a single license.

Presenting at SQL Saturday Charlotte

Lots of public appearances this month! I’ll be presenting “Best Practices for Implementing an Enterprise BI Solution” at SQL Saturday Charlotte BI Edition on October 19th immediately after SQL Pass. I hope to see you there!

Presenting at Visual Analytics Science and Technology Conference

I believe that the Pareto 80/20 principle applies well to a sound BI strategy where 80% of the BI needs should be addressed by Organizational BI (data warehouse, semantic layer, dashboards, operational reports, descriptive analytics, predictive analytics, big data, etc.) and 20% should be left for self-service BI. One of the areas where self-service BI excels is to promote lateral thinking. A business users can quickly test ideas and hypotheses by importing, mashing up, and visualizing data. This is why I’m excited to present at the Visual Analytics Science and Technology Conference in Atlanta on October 16th. The session title is “Self Help BI: How Self-service BI Promotes Lateral Thinking” and it’s included in the “Using Visual Analytics to Foster Lateral Thinking about Business Problems” workshop. I’ll show how a business users can use the Excel reporting and data mining capabilities to test ideas and then share the results by deploying to the cloud.

WORKSHOP: Using Visual Analytics to Foster Lateral Thinking about Business Problems

DATE & TIME: October 16, 08:30 am – 12:10 pm ET

LOCATION: A 706+707

Lateral thinking (also called divergent thinking) is a critical part of the sense making process. Moreover, researchers in the field of Visual Analytics have recognized that iterative and sequential rounds of ‘Convergent Thinking’ and ‘Lateral Thinking’ are necessary for arriving at the most insightful observations. The same pattern is at the heart of ‘Design Thinking’ practiced by creative professionals. The approach leads them to holistic problem solutions that exceed what could be achieved through pure a ‘Convergent Thinking’ approach. However, most of the BI and analytics systems used by business organizations include tools and interactive features (like filtering, sorting, selecting or ‘data brushing’) that are primarily ‘convergent’ in nature. There is little or no support for lateral ideation. Yet lateral thinking has a fairly well developed body of knowledge and includes easy to use techniques for developing out-of-the-box, creative design ideas. Business practitioners regularly use ideation techniques like ‘6 Hats’, ‘HIT Matrix’ and ‘BrainWriting’ to bring structure to brainstorming sessions that seek out-of-the-box business ideas. Most new design or business ideas start as a ‘sketch’ or early visualization of the idea. But there are no formal tools or techniques in commercial BI systems that allow business users to develop ‘sketches’ of alternative business scenarios though forced and controlled data experiments – just the way a ‘HIT matrix’ or ‘6 Hats’ technique does in Lateral Thinking workshops. This session will introduce a number of ideation techniques designed for lateral thinking and foster discussion around how these approaches can be leveraged in the visual analytics context. The session will bring together researchers and practitioners to think about ways this can be done, and discuss challenges and potential solutions.

I hope you can make it!