It looks like Carlos will deliver another slam tonight with a record number of some 63 people registered and counting… Join our Atlanta BI meeting at 6:30 to see his Data Warehouse Physical Design Best Practices presentation.
https://prologika.com/wp-content/uploads/2016/01/logo.png00Prologika - Teo Lachevhttps://prologika.com/wp-content/uploads/2016/01/logo.pngPrologika - Teo Lachev2013-03-25 20:32:252016-02-15 12:27:16Data Warehouse Physical Design Best Practices Session by Carlos Rodrigues at Atlanta BI Tonight
Requesting both historical and transactional reports is a very common requirement. As they stand, neither Multidimensional nor Tabular are designed to support well transactional (detail-level) reporting with large datasets, as I discussed in my Transactional Reporting with Tabular blog post. There are two query options that might provide some relief with transactional reporting and they both have limitations.
DRILLTHROUGH QUERIES
You can use a DRILLTHROUGH query to request data at the lowest level. The syntax differs somewhat between Multidimensional and Tabular. Here is a sample drillthrough query to Adventure Works cube:
DRILLTHROUGHMAXROWS 1000
SELECTFROM [Adventure Works]
WHERE ([Measures].[Reseller Sales Amount],[Product].[Category].[Accessories],[Date].[Calendar Year].&[2006])
RETURN
[$Product].[Product],
[$Date].[Date],
[Reseller Sales].[Reseller Sales Amount],
[Reseller Sales].[Reseller Tax Amount]
And a similar query to Adventure Works Tabular:
DRILLTHROUGHMAXROWS 1000
SELECTFROM [Model]
WHERE ([Measures].[Reseller Total Sales],[Product].[Category].[Category].&[Accessories],[Date].[Calendar].[Year].&[2005])
RETURN
[$Product].[Product Name],
[$Date].[Date],
[$Reseller Sales].[Sales Amount],
[$Reseller Sales].[Tax Amount]
Notice that the WHERE clause specifies the coordinate that is drilled through. The optional RETURN statement enumerates the columns you need in the output with dimensions prefixed with a dollar sign. Since Tabular doesn’t have measure groups, you treat all tables as dimensions.
Drillthrough queries are very fast. They honor the data security (both dimension data security in Multidimensional and Row Filters in Tabular). Not allowed members simple don’t exist as far as DRILLTHROUGH is concerned. For example, attempting to request a dimension member outside the allowed set would return the following error:
Drillthrough failed because the coordinate identified by the SELECT clause is out of range.
This is the same error you will get if your request a non-existent or wrong dimension member.
DRILLTHROUGH queries have limitations:
You can’t request measures from different measure groups in Multidimensional, such as Internet Sales and Reseller Sales. If you attempt to do so, you’ll get the following error: Errors from the SQL query module: Drillthrough columns must belong to exactly one measure group. The columns requested by the drillthrough statement are referencing multiple measure groups.
The WHERE coordinate must resolve to a single coordinate. In other words, you can’t specify a set, such as {[Product].[Category].[Accessories],[Product].[Category].[Bikes]. You can avoid the error by using SUBSELECT instead of WHERE but you’ll find that the SUBSELECT clause doesn’t set the default member and you’ll get all products. This limitation will prevent you from using multi-select parameters in SSRS.
Related to the previous item, you can’t specify FILTER conditions either, e.g. where the transaction date is between a range of dates. Again, you can only use a tuple in the WHERE clause.
You must use the Analysis Services OLE DB provider in SSRS. If you need to parameterize the query, you need to use an expression-based query statement.
SQL QUERIES
You can also use SQL-like queries as Chris Webb explains in the “Can I run SQL against an Analysis Services cube?” blog. Here is a SQL query against the Adventure Works cube:
where [Adventure Works].[$Date].[Calendar Year] = ‘CY 2008’
SQL queries have limitations as well:
You must specify SQLQueryMode=DataKeys in the connection string if you connect to Tabular.
SQL queries don’t work with data security (row filters) in Tabular but they appear to work with dimension data security in Multidimensional. Attempting to execute a SQL query against a Tabular model with row filters will throw the following exception: Tabular queries are not supported with row level security.
Unlike T-SQL, SSAS SQL queries support only the equal operator. Anything else and you’ll get the following error. This limitation precludes more complicated filtering, such as returning only transactions within a given date range. Errors from the SQL query module: There is an unexpected operator in the WHERE clause. Only the Equals operator ( = ) is supported.
You must use the Analysis Services OLE DB provider in SSRS. Unlike DRILLTHROUGH, you can use AND in the WHERE clause to support multi-valued parameters. However, since the Analysis Services OLE DB provider doesn’t support parameters, you must resort to using an expression-based query statement.
Feel-free to join me to escalate this issue to Microsoft because historical and transactional reporting are both very common scenarios. Thanks to its in-memory nature and more relaxed schema requirements, Tabular is best positioned to support both in a long run so I hope that Microsoft will make improvements in this area. For now, when SSAS doesn’t give you the performance you need, consider delegating transactional reporting to the Database Engine.
https://prologika.com/wp-content/uploads/2016/01/logo.png00Prologika - Teo Lachevhttps://prologika.com/wp-content/uploads/2016/01/logo.pngPrologika - Teo Lachev2013-03-24 18:27:002016-02-15 12:30:59Query Options for Analytical Models and Transactional Reporting
Scenario: We had a requirement to replace the existing implementation of transactional reporting over large data volumes. By “transactional reporting” I mean allowing the user to query individual transactions as they’re stored in the fact table. In some cases, this style of reporting requires simply reading data without aggregations. This, of course is what RDBMS are designed for but in our case, requirements call for extending the reporting model with metadata about the item, such as the item barcode, alias, etc., as well as supporting fast aggregation analysis (for trend reports) and data security. In general, when implementing BI solutions, you should always have an analytical layer between the database and presentation layer for the reasons I discussed in the “Why an Analytical Layer?” blog.
Challenges: Because of the in-memory nature of Tabular and more relaxed schema requirements, such as no separation of dimension and fact tables and ability to keep text-based columns in fact tables, we opted for Tabular on top of a data warehouse and star schema. Our initial schema included an Item dimension table (700 million rows) where the item metadata is kept and Transactions table (1.5 billion rows) that stores the item transactions. However, as we found out quickly, this design presented challenges for Tabular:
Excessive processing time – It took very long to process the initial model. By default, SSMS generates a transactional processing batch that supports processing multiple tables in parallel. However, if there is an error during processing the entire transaction is rolled back and you need start from scratch. To avoid this, we tried scripting the batch and changing it to non-transactional (Transaction=’false’). This option preserves the processed partitions but it doesn’t allow tables to be processed in parallel. This is by design to avoid unexpected interactions due to the potential cross-object dependencies in the recalculation chain. Since both the Item and Transactions tables were portioned, the net effect was that the processing was serialized by table and partition when two scripts for processing Item and Transactions are simultaneously executed (partition 1 of Transactions is processed, partition 1 of Item is processed, partition 2 of Transactions is processed, partition 2 of Item is processed, and so on). To make things worse, there is currently a bug with Tabular where the server builds relationships even when Process Data is used as a processing option which further slows down processing.
Excessive memory footprint – For some reason, Tabular used a lot of memory with the two table approach. Granted, we had to load the dataset twice (one for Item and a second time for Transactions) but still it should have taken less memory (see the memory footprint in the Solution section). The development server had 80 GB of RAM. We ran out of memory half-way during the full load and ended up with the in-memory model taking 65 GB of RAM.
Excessing query time – This was the worst. When we tried Power View as a reporting tool, each time the Item table was involved in the query, the report took more than a minute to finish. The report filter would return only in a few rows from the Transactions table but when the join was made to the Item table (one the one side of the Item-Transactions relationship), the report performance would degrade significantly. As it turned out, Tabular hasn’t been tuned for such scenarios where queries involve large dimension tables and the filter is applied on the fact table.
Solution: To work around the Tabular limitations, we merged the two datasets by joining the Item and Transactions tables in a SQL view. This approach resolved all issues:
Processing time was reduced x10 because Tabular had to process only one large table.
The memory footprint of the entire database with all the data was reduced to 13.5 GB.
The query times went down to seconds.
The only caveat is that processing would incur a hit because of the join between two large tables but we’d rather spend more time during processing than sacrificing query performance.
At least for now, don’t be confused by the “relational” nature of Tabular. It’s still optimized for queries that request a restricted set of columns and aggregate data. Currently, it’s not optimized for transactional (detail-level) style of reporting that requires many columns and requests data at the lowest level. Microsoft is aware of this and would probably introduce optimizations in time.
In a future blog, I’ll discuss techniques to optimize the query performance with transactional reporting and Tabular. Many thanks to Marius Dumitru (Principal Architect on the SSAS team) for answering my questions.
When you develop an organizational Tabular model in SSDT, there is always an implicit processing phase for each action you perform, such as renaming columns, creating hierarchies, changing formatting, and so on. This “data-driven” paradigm could be both a blessing and a curse. A blessing, because you always work with data and you don’t have to explicitly process the model to see the effect of the changes. And a curse, because each time you make a change the UI blocks until the change is committed and this can get old pretty soon.
Note: As long as you don’t use the Table Properties dialog or explicitly refresh the data, all changes are done directly in the Tabular database and Tabular doesn’t re-query the data source to refresh the data.
While waiting for Microsoft to make the necessary changes, here are a few tips to improve your Tabular design experience:
In my experience, the size of the dataset doesn’t affect the duration of the “refresh” step. However, I always use a small dataset during development for faster processing. To do this, if you have a large table, partition the table in Tabular and load only one (e.g. the smallest) partition. If you have already loaded all partitions, you can clear all but one with Process Clear. Now, you have a small dataset to work with during development. Once you deploy to the QA or production server, you can process all partitions.
Disable Automatic Calculation – To do this, go to the Model menu and click Calculation Options -> Manual Calculation. Sometimes (depending on model/calculation complexity) disabling automatic calculation in SSDT may help make modeling operations more responsive. To update the calculated columns, once you’re done with the changes, do Model->Calculate Now. Thanks to Marius for this tip.
While the size of the dataset doesn’t affect the refresh duration, the hardware configuration of your development machine does. Suppose you have an underpowered company laptop and a more powerful personal laptop (lots of memory, solid state drive, many cores, etc.) If your company policy allows using your personal laptop, follow these steps to temporarily switch development during the change-intensive part of the design process:
Copy the source from the first laptop to your personal laptop.
Back up and restore the workspace database to your local Analysis Services Tabular instance. If you follow my first tip, the workspace database should be fairly small.
Load the project in SSDS and double-click the Model.bim file to initialize your environment. This will create a second empty workspace database to your local Tabular instance. Close the solution in SSDT. Now, open the Model.bim_<your name>.settings file in Notepad, find the <Database>element and change it to the name of the original workspace database. Open the solution in SSDT. Now you should see the data in your original workspace database.
Perform the design changes. As a comparison, it takes about 5 seconds to commit a change on my laptop vs. 15 seconds on an underpowered laptop.
Once you’re done with the changes, replace Model.bim and Model.bim.layout files on your company’s laptop.
I’ve been running in this situation quite often so I thought this will make a good topic for a blog.
Scenario: Management has asked for some sort of a BI solution, such as a dashboard. BI hasn’t happened to the organization in question yet. But they have smart developers and there is no project that they can’t do. As the story goes, developers go to work and whip out some code… lots of it. Code for doing ETL, code for the database layer, and code for implementing the presentation layer, such as as a custom web application with cool third-party widgets. Everyone is happy… at least for a while.
I don’t have an issue with developers. In fact, I spent most of my career writing code. However, there are several pitfalls with this approach so let’s mention some of them:
Custom code is expensive to write and maintain – Developers are pulled away from their primary tasks to implement the BI solution. When the initial enthusiasm wears off, managers find it difficult to allocate developers to extending and maintaining the BI solution.
You end up with a proprietary, tightly-coupled solution – The solution would probably meet the initial goals but it might be difficult to extend. What if the custom web application is not enough and users prefer to analyze data in another tool, such as Microsoft Excel? Where are business calculations defined? How do you handle security?
Not the right tools – There are many scenarios when writing custom code makes sense but BI is not one of it. There are specialized tools that are geared specifically toward BI. If you write custom code, more than likely you’ll face performance and maintenance challenges in a long run.
Not a best practice – Most projects start simply but grow in complexity over time. It’s not uncommon for management to ask for more features, such as analyzing data by other subject areas or drilling to details. What’s has started as a dashboard project might evolve to an end-to-end BI solution that requires a data warehouse, analytical layer, and different presentation options.
Coders are not BI pros – I hate to say this but even the smartest programmers don’t know much or care about BI. More than likely, you’ll end with a normalized database and summary tables for improving performance with aggregates. Again, there tools and methodologies for BI so there is no point reinventing the wheel. If you don’t know better, hire someone who does. “When all you have is a hammer everything looks like a nail” paradigm won’t bring you too far.
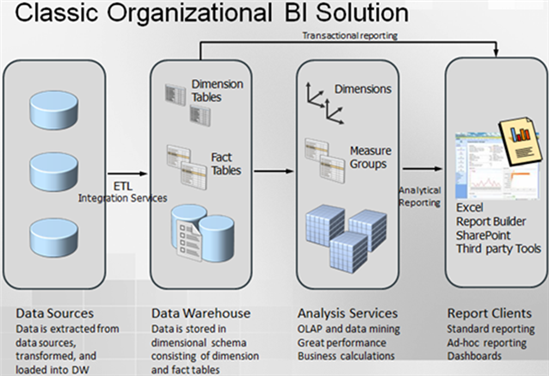
Solution: I’m sure you can add to the list, but what’s the solution? When you hear about BI or its manifestations, such as dashboards, reporting, analytics, etc., the following architecture should immediately come to mind.
This architecture is somewhat simplified. For example, it doesn’t show a staging database but it has the main pieces and their corresponding technologies in the Microsoft BI platform:
A data warehouse whose schema is designed with reporting in mind.
Integration services packages for ETL processes. They still have to be maintained but I dare to declare that maintaining SSIS is much easier that maintaining custom code. For example, it doesn’t require coding skills, it scales well, and it has a comprehensive logging infrastructure.
An analytical layer, either as a multi-dimensional cube or a tabular model. This is the most overlooked piece but it’s the most important for the reasons I explained in my “Why an Analytical Layer?” blog.
Finally, just like a car manufacturer, you should strive to assemble your solution with prefabricated parts instead of writing custom code. For example, you can implement very compelling dashboards with Power View that uses your analytical layer as a data source without having to write a single line of code. Not to mention that you can delegate this task to business users.
Now, with custom code you can do anything, including features that you can’t get out of the box with prepackaged BI tools. However, you’ll be surprised how willing your management might be to compromise with features especially in this economy.
https://prologika.com/wp-content/uploads/2016/01/logo.png00Prologika - Teo Lachevhttps://prologika.com/wp-content/uploads/2016/01/logo.pngPrologika - Teo Lachev2013-03-09 23:36:002016-02-15 12:42:08When Developers and BI Collide
Scenario: You have defined an MDX set in the cube script, such as a set that returns a few months. For the sake of simplicity, we will hardcode the months.
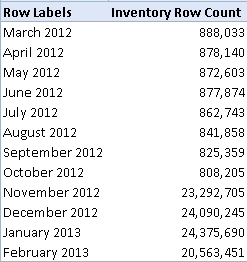
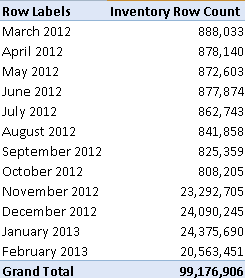
You’re on the right path. Now, you’ll get the grand total row in Excel but it shows the unrestricted (non-visual total) total instead of the total across set members only. Instead, use the VisualTotals() function:
Here, the VisualTotals function returns the All member with the total adjusted to set members only. Notice also that I’ve changed the set definition to by dynamic (DYNAMIC keyword) to force re-evaluation of the set.
In a slightly more complicated scenario, what if you want the total to appear as an additional member of the set as opposed to a grand total row. One implementation approach will be to add a dimension calculated member to the Month hierarchy that does the aggregation and then add the new member to the set:
CREATE MEMBER CurrentCube.[Date].[Month].Agg ASAggregate([Date].[Month].&[201302].Lag(11):[Date].[Month].&[201302])
https://prologika.com/wp-content/uploads/2016/01/logo.png00Prologika - Teo Lachevhttps://prologika.com/wp-content/uploads/2016/01/logo.pngPrologika - Teo Lachev2013-03-08 20:47:002016-02-15 12:46:40Adding a Set Total
Scenario: Run ETL to perform a full data warehouse load. One of the steps requires joining four biggish tables in a stating database with 1:M logical relationships. The tables have the following counts:
VOUCHER: 1,802,743
VOUCHER_LINE: 2,183,469
DISTRIB_LINE: 2,658,726
VCHR_ACCTG_LINE: 10,242,414
Observations: On the development server, the SELECT query runs for hours. However, on the UAT server it finished within a few minutes. Both servers have the same data and hardware configuration, running SQL Server 2012 SP1.
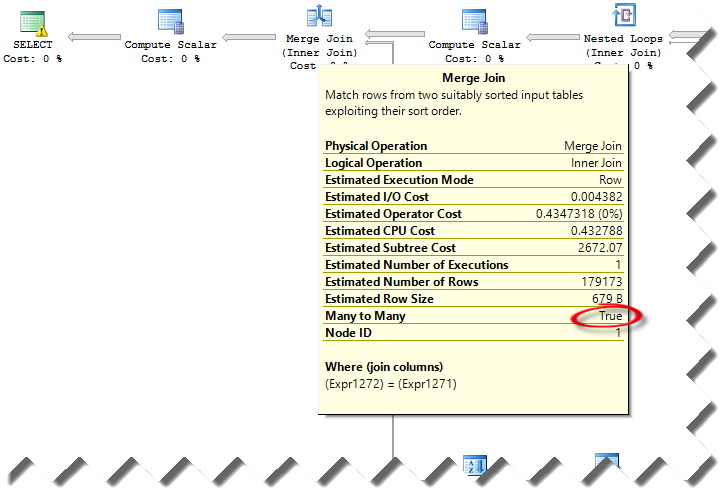
Solution: Isolating the issue and coming up with a solution wasn’t easy. Once we ruled out resource bottlenecks (both servers have similar configuration and similar I/O throughput), we took a look at the estimated query plan (we couldn’t compare with the actual execution plan because we couldn’t wait for the query to finish on the slow server).
We’ve notice that the query plans were very different between the two servers. Specifically, the estimated query plan on the fast server included parallelism and hash match join predicates. However, the slow server had merge M:M join predicates. This requires a tempdb work table for inner side rewinds which surely can cause performance degradation.
Interestingly, the cardinality of the tables and estimated number of rows didn’t change much between the two plans. Yet, the query optimizer decided to choose very different plans. At this point, we figured that this could be an issue with statistics although both servers were configured to auto update statistics (to auto-update statistics SQL Server requires modifications to at least 20% of the rows in that table). The statistics on the slow server probably just happened to have a sample distribution that led to a particular path through the optimizer that ended up choosing a serial plan instead of a parallel plan. Initially, we tried sp_updatestats but we didn’t get an improvement. Then, we did Update Statistics <table name> With Fullscan on the four tables. This resolved the issue and the query on the slow server executed in par with the query on the fast server.
Note: Updating statistics with full scan is an expensive operation that probably shouldn’t be in your database maintenance plan. Instead, consider:
1. Stick with default sampled statistics
2. Try hints for specific queries that exhibit slow performance, such as OPTION (HASH JOIN, LOOP JOIN) to preclude the expensive merge joins.
Special thanks to fellow SQL Server MVPs, Magi Naumova, Paul White, Hugo Kornelis, and Erland Sommarskog for shedding light in dark places!
Microsoft released a while back a cumulative update 2 for SQL Server 2012 SP1. Besides other things, it includes a fix for the “wide” MDX query performance degradation issue with Analysis Services that I previously reported.
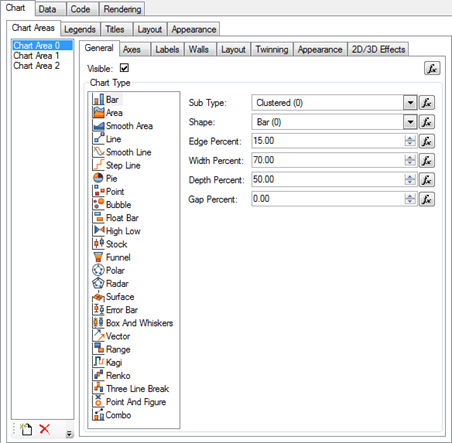
Nevron was kind enough to show me their chart and gauge for Reporting Services. In certain areas, their products exceed the charting capabilities of Reporting Services. Here are the highlights:
The product provides support for SQL Server Reporting Services (SSRS) 2005, 2008, 2008R2 and SQL Server Data Tools (SSDT) 2012.
Advanced Chart Designer
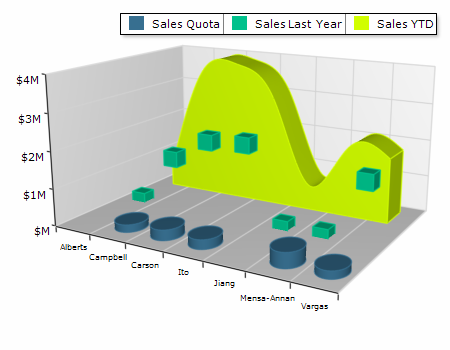
Complete set of 2D and 3D Charting Types
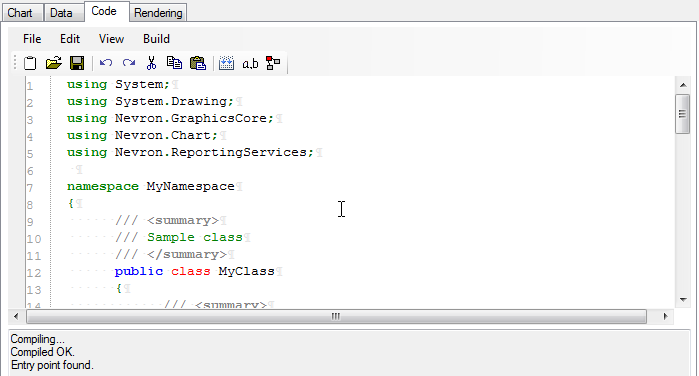
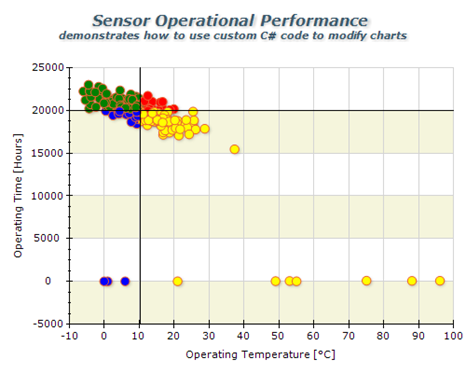
Support for Code Customization – Nevron Chart for Reporting Services supports customization through C# code, which allows you to use the full Nevron Chart for .NET API in SSRS and achieve a higher degree of customization.
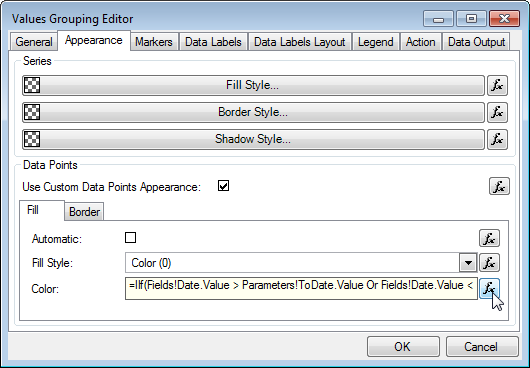
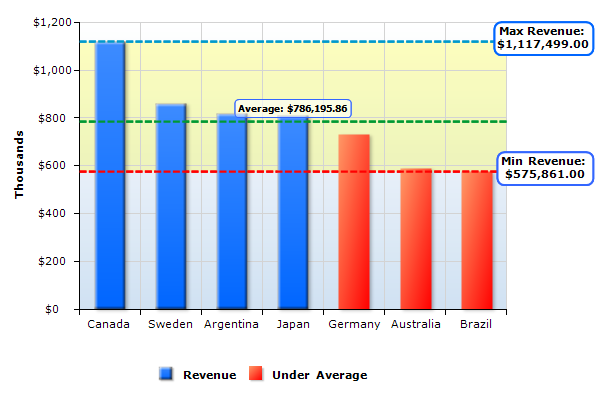
Expressions Everywhere – Nearly all properties of the Chart report item can now be specified by expressions. Appearance styles (fill, stroke, shadow and text) are also reworked to support both constant specification and specification that is based on expressions. This allows you to bind nearly all configurable aspects of the report item to user defined parameters and/or data.
Support for 2D/3D Combo Charts – Combo Charts are used to combine certain series types within the same chart area.
XML Formatted Texts – This feature is applicable to all elements which display text. It allows you to mix fonts, mix bold, italic underline formatting and many other advanced features like different fill styles, shadows, image filters etc. – all inside a single label, title etc.
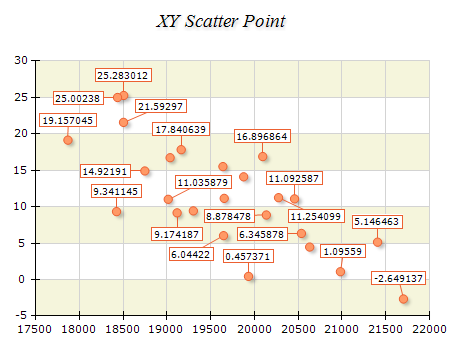
Non-overlapping Data Labels Layout – All Cartesian Chart types support automatic non-overlapping data labels layout. The data label layout prevents labels from overlapping in both ordinal and scatter charts and works in 2D and 3D appearance modes.
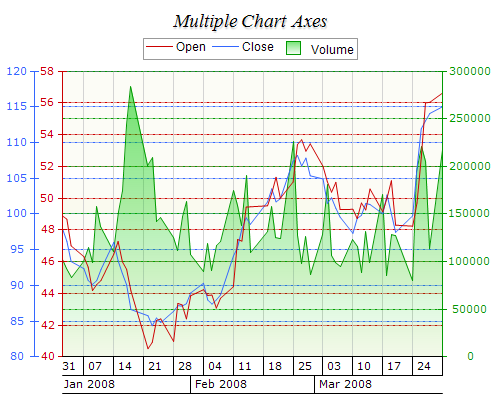
Advanced Axis Model – complete set of axis-related features designed to target even the most compelling charting requirements.
Suppose your company has a web application that allows customers to enter comments, such as to provide feedback about their product experience. How do you derive knowledge from these comments? Perhaps, customers are complaining a lot about a particular product. Or, they are raving about your service. Enter semantic search – a new feature in SQL Server 2012.
Building upon full text search, semantic search allows you to search not only for words, but also for the meaning (semantics) of these works. Mark Tabladillo, Ph.D., gave us great presentation at our Atlanta BI January meeting. He demoed how semantic search can be used to find the most common phrases in a document and how to find similar documents from a given search criteria.
Besides external documents, you can apply semantic search to text data already stored in a database, such as a text-based Comments field. Again, this is possible because semantic search builds upon the full-text search capabilities of SQL Server. So, any column that supports full-text search can be enhanced with semantic search.
Going back to my scenario, here is what it takes to configure a text field for semantic search:
When you use semantic search, SQL Server performs statistical analysis of the words in the column contents. This analysis requires base data that is provided as a SQL Server database. Because the database is not installed by default, as a perquisite of using semantic search, you need to run the semantic database installer. The installer can be found on the SQL Server setup disk in the following folders:
For x86, the setup is \x86\Setup\SemanticLanguageDatabase.msi
For x64, the setup is \x64\Setup\SemanticLanguageDatabase.msi
The setup simply extracts the MDF and LDF files of the semantic database to a folder that you specify during the installation. Next, simply attach the semantics database to your SQL Server 2012 instance as you would with any other database.
The next step is another step that you need to perform only once for each SQL Server instance. Register the semantics database using this command:
This command creates a semantic-enabled full-text index on the Comments column in the Production.ProductReview table on the AW2008FullTextCatalog full text catalog. The AW2008FullTextCatalog text catalog is included with the AdventureWorks2012 database. The CHANGE_TRACKING = AUTO clause instructs SQL Server to auto-update the index, and STOPLIST = SYSTEM specifies that the default full-text system STOPLIST should be used to parse words.
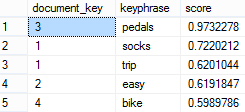
5. Now that you’ve done the ground work, you can perform the semantic search. For example, the following query returns the most frequent words for each document:
Note that the document_key matches the ProductReviewID column (primary key) of the [Production].[ProductReview] table allowing you to match the semantic search results to the document. For example, “socks” and “trip” were found in the row with the primary key of 1 whose Comments column contains the following text:
“I can’t believe I’m singing the praises of a pair of socks, but I just came back from a grueling 3-day ride and these socks really helped make the trip a blast. They’re lightweight yet really cushioned my feet all day. The reinforced toe is nearly bullet-proof and I didn’t experience any problems with rubbing or blisters like I have with other brands. I know it sounds silly, but it’s always the little stuff (like comfortable feet) that makes or breaks a long trip. I won’t go on another trip without them!”
You can feed these results to a data mining model if you want to learn which phrases customers tend to use together similar to identifying what products customers tend to purchase together (market basket analysis). “Together” here means within a specific document.
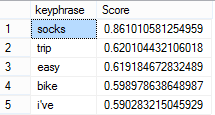
What if you want to get the most popular phrases across all comments? I think the following query should help although there might be a better way. The query groups phrases and sorts them in a descending order by the average score. SELECTTOP(5)KEYP_TBL.keyphrase,AVG(score)AS Score