Business Intelligence Semantic Model – TechEd Redux
While I’ve been busy at TechEd talking to BI enthusiasts, professionals and wannabes and delivering sessions, the news is out about the new BI roadmap and BISM positioning. See:
- T.K. Anand blog
- T.K. Anand & Ashvini Sharma recorded session What’s New in Microsoft SQL Server Code-Named “Denali” for SQL Server Analysis Services and PowerPivot”?
- Sean Boon, Carolyn Chao, and Sabrena McBride recorded session Abundantly “Crescent”: Demos Galore
- Julie Strauss’ recorded session The Next Generation Design Tools for Analysis Services
- And the feedback from the community insiders, including Chris Webb’s Good News on the Future of Analysis Services blog, Marco Russo’s Microsoft Updates its BI Roadmap blog, and Boyan Penev’s SSAS to BISM – Recent Developments blog.
So, I won’t repeat what’s been already said. Instead, I’ll attempt to summarize my thoughts about the new BI developments and give you some take-home points to help you plan future BI work.
- I spent many hours with the SSAS and SSRS product groups at TechEd. I liked what I saw. I saw the SSRS and SSAS teams working together. I saw the impressive visualization capabilities of the sleek Crescent tool which will give the competition a run for their money. And I saw the future of Analysis Services and Microsoft BI platform – the new BISM model that is positioned to become what UDM promised to be.
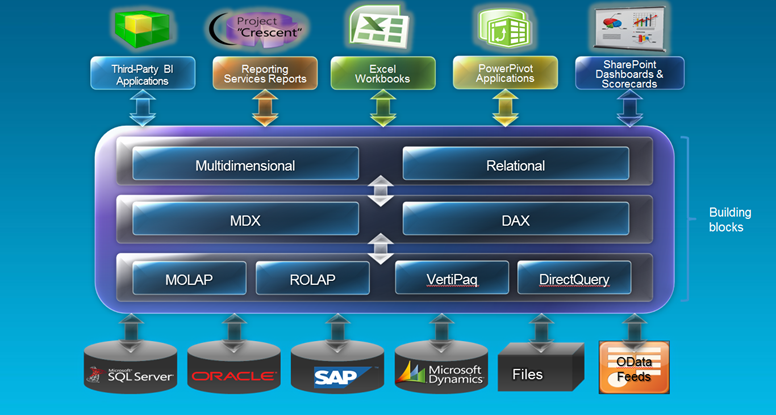
- BISM is now the unifying name for both the Multidimensional (OLAP) and Tabular or Relational (in-memory) models. Both models will support MDX and DAX query options. Consequently, Excel can see a tabular model as a cube and query it with MDX, while Crescent will be able to see an OLAP cube as a tabular model and send DAX queries to it. This is awesome news that warrants retreating the Ugly part from my blog Business Intelligence Semantic Model – The Good, The Bad, and the Ugly. Kudos to Microsoft for listening to the community and kudos to MVPs for providing relentless feedback!
- Make no mistake though. Although the external interfaces are the same and there is a significant feature overlap, in Denali the two models will not compatible with each other and no migration path will be provided, e.g. OLAP to Tabular or vice versa. An analogy might be helpful here. Think of Microsoft Access and SQL Server relational databases. Both of them are databases, both support SQL, and both have similar features (tables, relationships, etc.). We could use the label “Relational Database Model” as a unifying name for both databases although each path leads to a completely different model. So, why we are implying a unification here? Think of BISM as a prediction of the future. In time, Tabular may “borrow” OLAP features, such as MDX scripts and OLAP may get Tabular’s elements, such as in-memory partitions. Thus, the divide between the models might blur to a point where the two paths converge into a single model.
- The most important thing to remember is that the Tabular model is not a replacement for OLAP cubes. Anybody and I repeat anybody, who claims the opposite should be brought to justice and tried in the BI Court. T.K. Anand from the Microsoft SSAS team has actually a faster procedure of strangling that person with his bare hands. You should see Tabular as completing and not competing technology to OLAP, a technology that opens interesting possibilities that were not previously possible with OLAP alone.
-
Regardless of naming and marketing, the question in everybody’s mind moving to Denali would be which path and model to choose for new projects. And, here is my simplified personal plan based on the type of the BI project at hand:
Self-service BI – This is a no-brainer – PowerPivot and Excel. If you want to let business users analyze data on their own, look no further than Excel.
Team BI – How do business users share PowerPivot models with other users? SharePoint and PowerPivot of course. Another no-brainer.
Corporate BI – This is where things get trickier. Let’s go through a few scenarios:
- If you’ve started on the PowerPivot path but have exceeded the PowerPivot capabilities, e.g. you need more data (above 2GB) or row-level security, then a PowerPivot model migrated to Analysis Services running in a VertiPaq mode will be a logical choice. This will give you a nice continuum of self-service BI – Corporate BI on a single platform.
- If all you need is a simple model that wraps a layer over a raw database or warehouse for reporting & analytics and you don’t have experience with OLAP, consider a tabular model and DAX because of its lower learning curve and less rigid data schema requirements. The issue I have with the “simple” model is that based on my experience many projects start simple but grow exponentially in complexity over time. A many-to-many relationship may creep in, as well as time calculations, currency conversion, etc. So, be careful here, evaluate requirements (if you have them) and take your time to weigh out features and prototype because switching from one model to another will require a complete rewrite. Continuing the Relational Database analogy above, it will feel like moving from Access to SQL Server and you won’t have a wizard. Denali Tabular won’t support OLAP features that we grew to love, such as declarative parent-child and many-to-many relationships (it does support them via DAX calculations but you’ll end up with a calculated measure for each numeric column as in the SSAS 2000 days), scope assignments for implementing time calculations, allocations and currency conversion, Excel what-if analysis, default members, named sets, and others. Although easy to start with, DAX calculations can become complex to a point where you might wonder what you are really saving by switching from MDX to DAX if you are after avoiding the MDX learning curve.
- Enterprise-wide BI and Data Warehousing – Here, I’d stick with multidimensional OLAP cubes for now. I won’t bet complex and high-visibility projects on Tabular, at least not for Denali. First, more than likely such projects will require the features I mentioned above. Second, I’d give Tabular some time to marinate in the corporate space. Finally, in Denali only Crescent will support Tabular natively via DAX. In comparison, there are many clients that are optimized to support MDX and OLAP cubes.
I’d like to indulge myself and think that one day, I hope in not so distant future, BISM will evolve to become a true single model that delivers on the UDM promise and combines the best of OLAP and Tabular. Then, we would be able to pick and mix features from both OLAP and in-memory paths, e.g. an in-memory storage with MDX calculations, and use the best technology for the task at hand. Until then, we will have to choose between the multidimensional and tabular paths.
 I’ll be presenting two breakout sessions at TechEd North America 2011 which will be held this year in my home city of Atlanta. The tentative titles of the sessions are:

